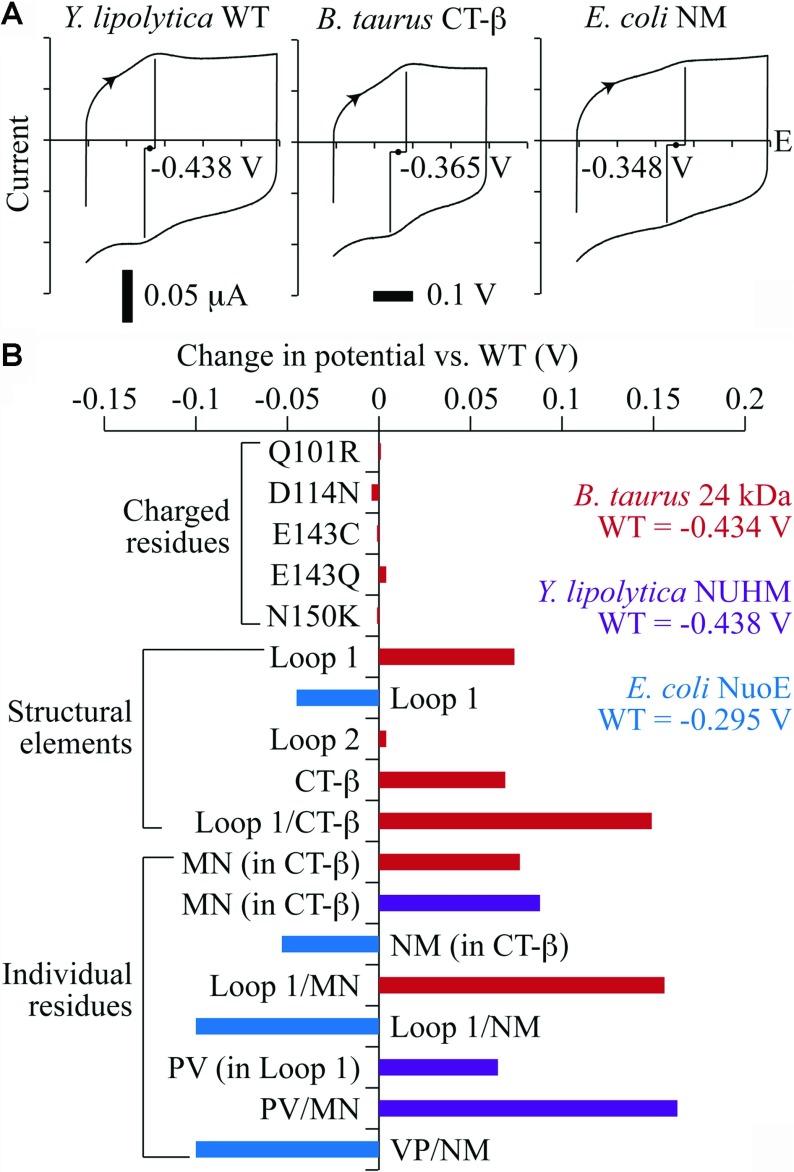
Figure 3. Reduction potentials of the [2Fe–2S] clusters in the overproduced 24 kDa subunit variants.
(A) Three examples of protein film voltammetry measurements of the reduction potentials of the [2Fe–2S] clusters in the variant proteins. The three cyclic voltammograms are all shown on the same scale; the reduction potentials are the average of the peak positions in the two scan directions. The proteins were adsorbed on a pyrolytic graphite edge electrode and the potential scanned at 0.02 V·s−1 from low to high potential and back at 4°C in a buffer containing 20 mM Tris/HCl (pH 8) and 0.5 M NaCl. Potentials are reported relative to the standard hydrogen electrode. (B) Reduction potentials of subunit variants, relative to their wild-type values, measured as in (A), with values from the B. taurus 24 kDa subunit in red, Y. lipolytica NUHM in purple and E. coli NuoE in blue.

