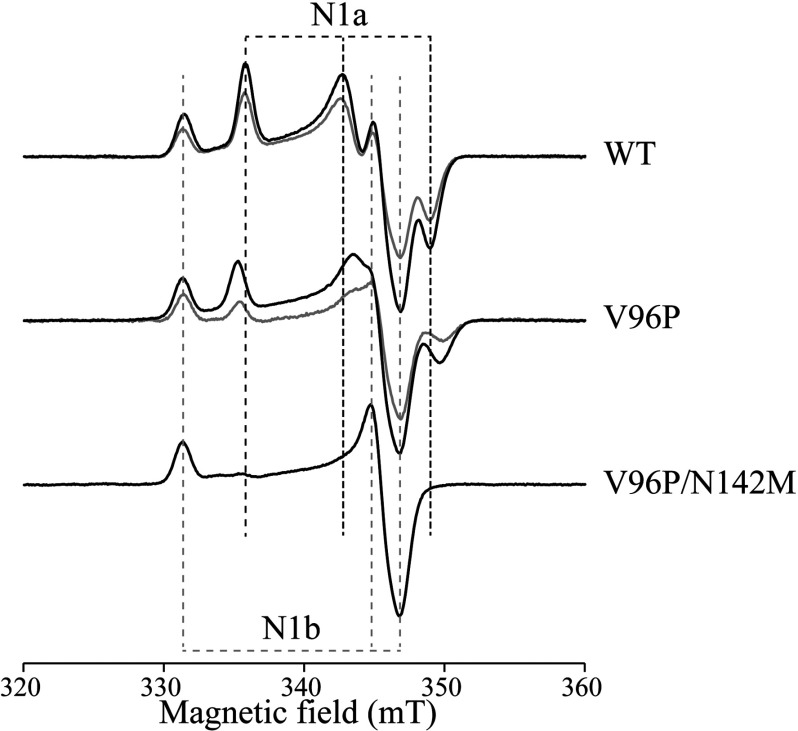
Figure 4. EPR spectra of variants of complex I from E. coli.
The spectrum of the NADH-reduced wild-type (WT) enzyme is compared with spectra from the NuoE V96P and V96P/N142M variants. Black spectra are from enzymes reduced with 5 mM NADH, under anaerobic conditions, to approximately −0.37 V (at pH 6.5). Grey spectra are from enzymes reduced with 1 mM NADH and 1 mM NAD+, to set the potential to approximately −0.31 V (at pH 6.5). The spectra all show a clear N1b signal, from the [2Fe–2S] cluster in the 75 kDa (NuoG) subunit; the N1a signal from the [2Fe–2S] cluster in the 24 kDa (NuoE) subunit is clearly visible in the WT and V96P spectra, but not in the V96P/N142M spectrum. The gz-signal from N1a is shifted in V96P. Spectra were recorded at 40 K and 1 mW microwave power, and have been normalized to the protein concentrations. The other parameters were: microwave frequency 9.38–9.39 GHz, modulation frequency 100 kHz, modulation amplitude 1 mT, time constant 81.92 ms, and conversion time 20.48 ms. Protein samples were in a buffer containing 50 mM Mes/OH (pH 6.5), 50 mM NaCl, 0.1% n-dodecyl-β-D-maltoside and 10% glycerol.

