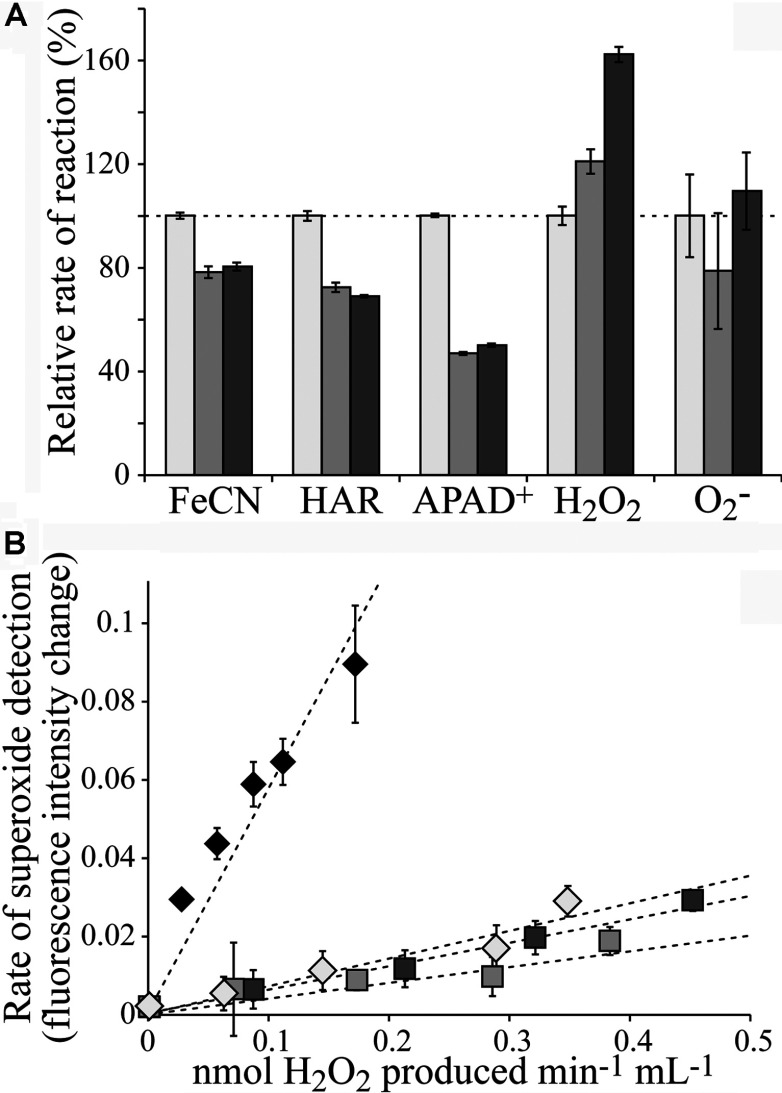
Figure 6. Flavin-site reactions catalysed by the 24 kDa subunit variants of complex I from E. coli.
(A) The rates of NADH oxidation (30 μM NADH), coupled with the reduction of FeCN (1 mM), HAR (0.5 mM) and APAD+ (0.5 mM), and coupled with O2 reduction detected as H2O2 or O2−. H2O2 was detected using the HRP–Amplex Red assay (10 μM Amplex Red and 2 units·ml−1 HRP), and O2− using DHE (50 μM DHE and 50 μg·ml−1 salmon sperm DNA). The rates for V96P (medium grey) and V96P/N142M (dark grey) are expressed relative to the wild-type rates (light grey). All assays were performed in a buffer containing 20 mM Tris/HCl (pH 7.5) and at 32°C. (B) Comparison of the ratio of H2O2 to O2− production. The total rates of H2O2 formation (from the dismutation of O2− and from H2O2 formed directly) were measured, over a range of complex I concentrations, and are plotted on the x-axis. They are compared with the rates of fluorescence intensity change of DHE, representing the relative rates of O2− production, by comparison with data from bovine complex I (black diamonds); bovine complex I produces predominantly O2− [25]. The wild-type enzyme (light grey diamonds) and both the variants (medium and dark grey squares) produce predominantly H2O2. Assays were in 30 μM NADH, in a buffer containing 20 mM Tris/HCl (pH 7.5), at 32°C.

