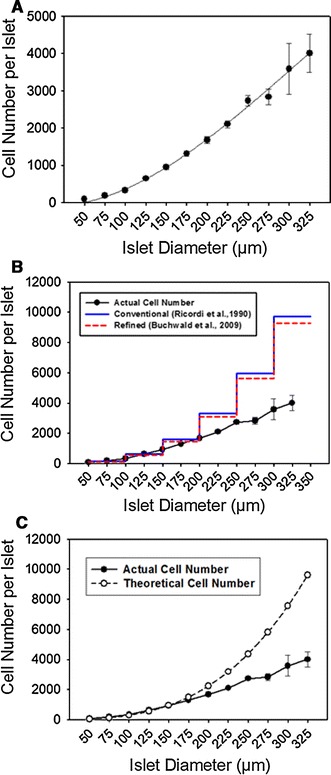
Fig. 1.

IE measurements overestimated the actual tissue volume in large islets. a The counted cell number per islets was plotted, and a third-order polynomial regression trend line with a r 2 of 0.8 produced the best fit with the data. b The measured relationship between islet size and actual cell number per islet was plotted in the black solid line. Two theoretical curves were plotted using the Ricordi’s conventional IE measurement with different categories of sizes in a 50-μm increments (blue step plot) [4] and using Buchwald’s refined IE measurement (red step plot) [2], based on our measured 943 cells per 150-μm diameter islet (1 IE). c Theoretical curve (dash line) was plotted based on the assumptions that islets are perfect spheres and all cell sizes are equivalent (color figure online)
