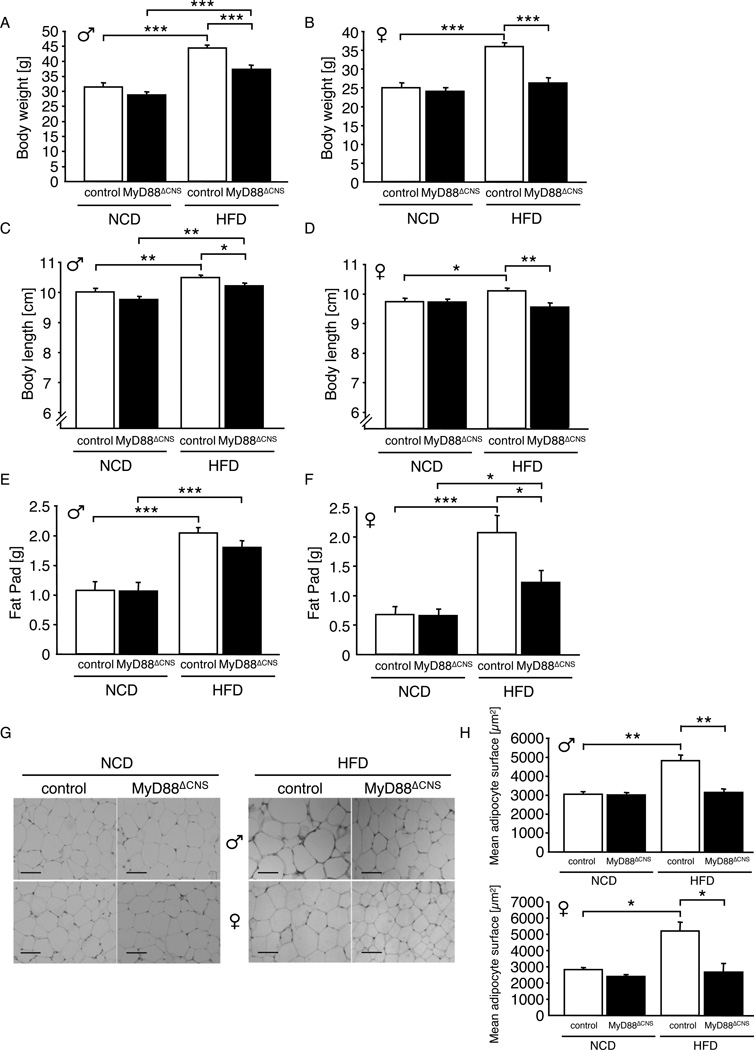
Figure 2. MyD88ΔCNS mice are protected from Diet-induced Obesity.
A Average body weight of male control and MyD88ΔCNS mice on normal chow diet (NCD) (n=12–15) and high-fat diet (HFD) (n=11–13) at the age of 16 weeks.
B Average body weight of female control and MyD88ΔCNS mice on NCD (n=12–14) and HFD (n=7–12) at the age of 16 weeks.
C Naso-anal body length of male control and MyD88ΔCNS mice on NCD (n=15) and HFD (n=19–21) at the age of 16 weeks.
D Naso-anal body length of female control and MyD88ΔCNS mice on NCD (n=12–14) and HFD (n=12–18) at the age of 16 weeks.
E Epididymal fat pad weights of male control and MyD88ΔCNS mice on NCD (n=15) and HFD (n=19–21) at the age of 16 weeks.
F Parametrial fat pad weights of female control and MyD88ΔCNS mice on NCD (n=12–14) and HFD (n=12–18) at the age of 16 weeks.
G H&E stain of epididymal/parametrial adipose tissue of male and female control and MyD88ΔCNS mice on NCD and HFD at the age of 16 weeks. Scale bar: 100 µm.
H Quantification of mean adipocyte surface in epididymal/parametrial adipose tissue of male (n=3–5) and female (n=3–5) control and MyD88ΔCNS mice on NCD and HFD at the age of 16 weeks.
Displayed values are means ± S.E.M.; *, p ≤ 0.05; **, p ≤ 0.01; ***, p ≤ 0.001.

