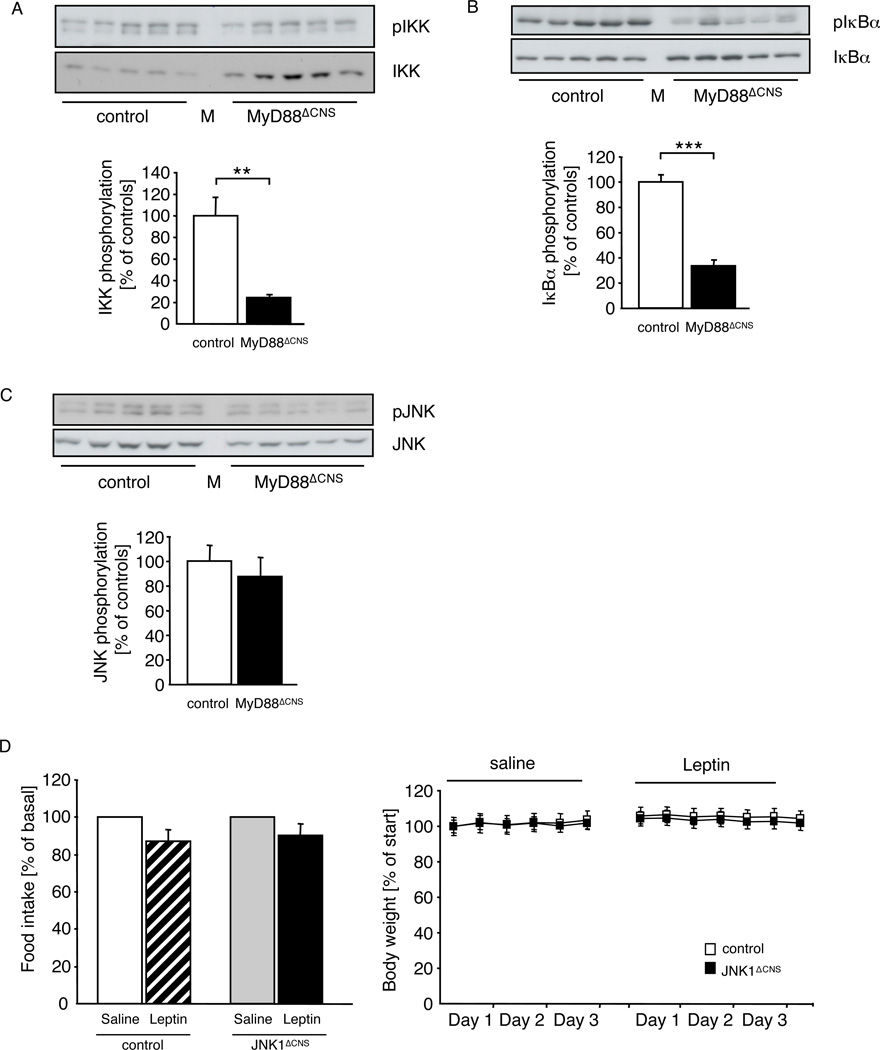
Figure 6. MyD88ΔCNS mice are protected from High-Fat Diet induced IKK-activation.
A Upper panel: Western blot analysis of phosphorylated IKK and IKK in dissected arcuate nuclei of 16-week-old control (n=5) and MyD88ΔCNS (n=5) mice. Lower panel: Densitometrical analysis of phosphorylated IKK of MyD88ΔCNS mice as compared to control mice. M: Molecular Weight Marker.
B Upper panel: Western blot analysis of phosphorylated IκBα and IκBα in dissected arcuate nuclei of 16-week-old control (n=5) and MyD88ΔCNS (n=5) mice. Lower panel: Densitometrical analysis of phosphorylated IκBαof MyD88ΔCNS mice as compared to control mice. M: Molecular Weight Marker.
C Upper panel: Western blot analysis of phosphorylated JNK and JNK in dissected arcuate nuclei of 16-week-old control (n= 5) and MyD88ΔCNS (n=5) mice. Lower panel: Densitometrical analysis of phosphorylated JNK of MyD88ΔCNS mice as compared to control mice. M: Molecular Weight Marker.
D Changes in food intake and body weight after intraperitoneal leptin treatment in control (n=8) and JNK1ΔCNS (n=8) mice on high-fat diet at the age of 13 weeks. Data represent daily food intake after a 3-day treatment with twice-daily injections of saline or 2 mg/kg leptin. Body weight was measured twice a day.
Displayed values are means ± S.E.M. **, p ≤ 0.01; ***, p ≤ 0.001.

