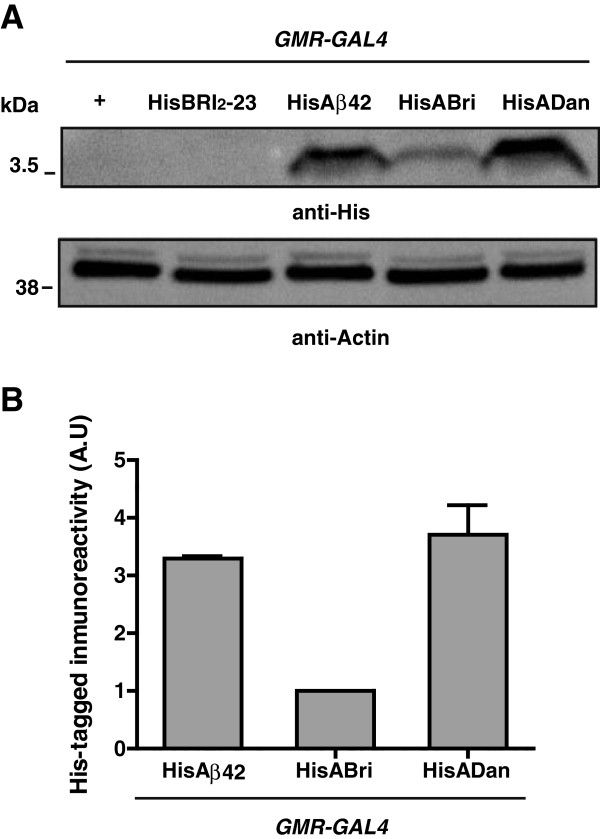
Figure 5.
Analysis of His-tagged amyloid protein levels. A, Western blots of fly head homogenates expressing two copies of His-tagged peptides in the eye. Top panel, anti-His shows different levels of monomeric HisAβ42, HisABri and HisADan accumulation in transgenic flies after 10 days p.e. In this experiment, the expression levels of HisBri2-23 were below the limit of detection. Bottom panel, Western blot of the same membrane re-probed with anti-actin antibody for loading normalization. B, quantification of HisAβ42 and HisADan levels relative to HisABri. At least 3 independent experiments were performed. A.U., arbitrary units.

