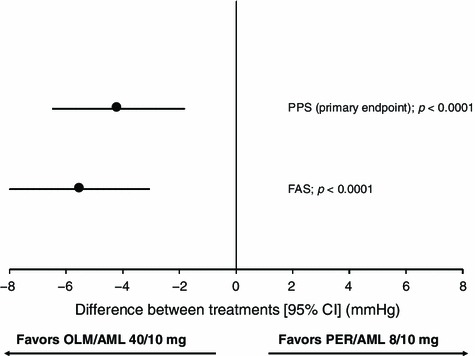
Fig. 3.

Forest plot of the differences between patients treated with OLM/AML 40/10 mg and PER/AML 8/10 mg in the absolute change from Week 0 to final examination in CSBP in the primary efficacy endpoint (PPS) and the FAS. P values represent the comparison between OLM/AML and PER/AML. Filled circles indicate the position of the point estimates for between-group differences and vertical lines indicate the 95% confidence intervals. AML amlodipine, BP blood pressure, CI confidence interval, FAS full analysis set, OLM olmesartan, PER perindopril, PPS per protocol set
