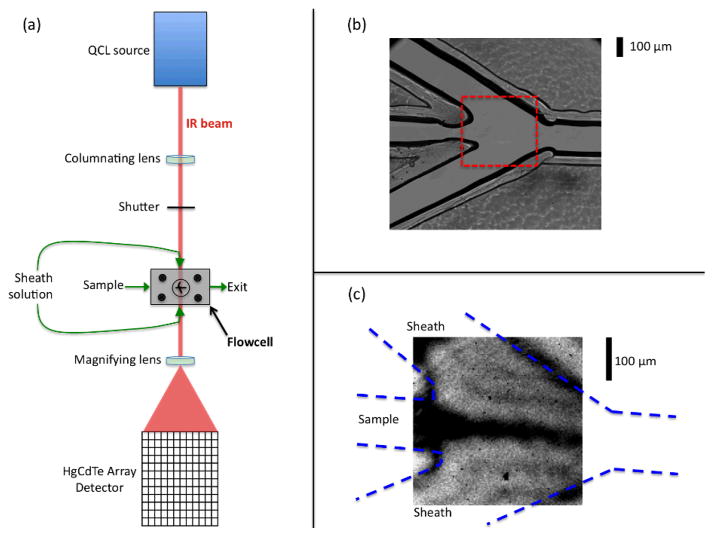
Figure 1.
Experimental design: (a) Schematic of the optical setup of the infrared flow system. (b) A magnified visible image of the mixer showing the three inlet channels coming together at the mixing region, and the exit channel. (c) A mid-IR transmission image of the portion of the cell indicated by the dashed box in part (b), which is the region that is routinely analyzed during flow experiments. This image was acquired with H2O flowing as the sample and D2O flowing as the sheath solution. The QCL is tuned to 1636 cm−1, a frequency that is strongly absorbed by H2O (the dark regions correspond to low transmittance).

