Abstract
Background:
Food security is a state in which all people at every time have physical and economic access to adequate food to obviate nutritional needs and live a healthy and active life. Therefore, this study was performed to quantitatively evaluate the household food security in Esfahan using the localized version of US Household Food Security Survey Module (US HFSSM).
Methods:
This descriptive cross-sectional study was performed in year 2006 on 3000 households of Esfahan. The study instrument used in this work is 18-item US food security module, which is developed into a localized 15-item questionnaire. This study is performed in two stages of families with no children (under 18 years old) and families with children over 18 years old.
Results:
The results showed that item severity coefficient, ratio of responses given by households and item infit and outfit coefficient in adult's and children's questionnaire respectively. According to obtained data, scale score of +3 in adults group is described as determination limit of slight food insecurity and +6 is stated as the limit for severe food insecurity. For children's group, scale score of +2 is defined to be the limit of slight food insecurity and +5 is the determination limit of severe food insecurity.
Conclusions:
The main hypothesis of this survey analysis is based on the raw scale score of USFSSM The item of “lack of enough money for buying food” (item 2) and the item of “lack of balanced meal” (3rd item) have the lowest severity coefficient. Then, the ascending rate of item severity continues in first item, 4th item and keeps increasing into 10th item.
Keywords: Current population survey, food security, household
INTRODUCTION
Food security is a state in which all people at every time have physical and economic access to adequate food to obviate nutritional needs and live a healthy and active life.[1] In countries like USA, wherein food security phenomenon has been studied constantly, hunger have been associated with sever levels of food insecurity, which is resulted by involuntary reduction of daily food portion among people or following of inappropriate nutritional regimen.[2] Over 800 million people all over the world have faced food insecurity in year 2004 that mostly live in developing countries.[3] This is while the statistics and information have dissembled the prevalence of hidden hunger and depleted the actual figures. Hidden hunger is the same as food deficiency without clinical symptoms of lack of nutrients and results in an increase of food insecurity and hunger prevalence in the society.[4,5] As a result, food and nutrition as well as malnutrition and hunger have been proposed world-wide for years. For instance, in 1996 World Food Summit in Italy in which heads of 186 countries participated and affirming the access to enough healthy food as an undeniable right for every human being, they expected to reduce hunger into half by year 2015.[6] Following to international movements, functional steps were also taken in Iran through planning and managing national development; as act against poverty was proposed as a principal subject in 3th development program.[2]
One of the obstacles in course of act or intervene against poverty and food insecurity is lack of proper arrangement and preparation for its administration, evaluation and assessment.[6] Many governments are not able to perform their poverty alleviation due to lack of a proper system for household food insecurity assessment.[7]
The first scientific and coherent study for measuring food insecurity and determining the measurement instrument was initially developed by Ministry of Agriculture of USA in year 1995 entitled US Household Food Security Survey Module (US HFSSM) via designing household food security measurement module. This module is designed and developed as a set of questions based on overall experiences of food insecurity. After passing several supervisory phases and complicated statistical manipulations based on scaling methodology and using linear and nonlinear factors, this module was set up as an 18 item questionnaire.[3,8]
Passing through this method (using localized questionnaire), food security was measured in several countries such as Venezuela, Mexico, Ecuador, Brazil and Columbia.[9,10,11,12,13,14,15,16,17,18] Studies of such kind are also being conducted in countries outside Continent of America using the above mentioned instrument. These countries include Islands, Bangladesh, Philippines, Bolivia and Burkina Faso.[19,20]
Moreover, some other questionnaires for measuring household food security have been designed and developed by developing countries based on the evaluation and conceptualization of local experiences of food insecurity, which contained questions about nutritional affording conditions of households and their dietary status, but it is to some extent different with that of US HFSSM.[21,22,23]
No action has been taken in our country by far in order to develop an accurate quantitative assessment instrument for measuring food security phenomenon; however, 9 years ago, Nutritional Studies Institute in collaboration with National Food Industry Organization launched a project in order to institutionalize food security, which has been an inclusive movement and a macro-policy in food issue. Still there is no statistics or information on current status of food security or its statistical and quantitative description for our society. It is pretty clear that without having such statistics and information and lacking a precise outline of household food security, no development action is practicable for improving people's life-style or prioritizing nutritional studies or interventions to reduce community's food problems. Therefore, this study was performed to quantitatively evaluate the household food security in Esfahan using the localized version of US HFSSM.
METHODS
This descriptive cross-sectional study was performed in the year 2006 (and extended for 12 months) on 3000 households of Esfahan who were randomly selected from 60 population clusters encompassing the overall economic and social texture of this city. The study instrument used in this work is 18-item US Food Security Module, which is developed into a localized 15-item questionnaire. This study is performed in two stages of families with no children (under 18 years old) and families with children over 18 years old. A number of questioners were employed and trained for this purpose and after verifying their performance through implementation of a trial questionnaire completion session, the questionnaires were delivered by them to the households. The questionnaires were filled by household's wife or an individual who was aware of family food consumption status. Since the questionnaire contained items about adult and child consumption, items about child consumption were asked from families with children otherwise only the adult questionnaire was completed.
The questionnaire used in this study was the modified and localized version of current population survey (CPS), which is in fact the same as US HFSSM.[1] CPS questionnaire is an instrument for measuring food security and insecurity severity within different periods and among different populations designed for 3-month or 12-month time intervals.
Appraising food security and insecurity and its severity in the questionnaire of the study was performed based on Rasch model,[9] which is a type of nonlinear analysis method of item-response theory. Data attained from questionnaire was analyzed using apposite software for this specific model.[1] A measure entitled “Item Score” or “Item Severity” was calculated for each item, which showed the level of solidity for each entry. Moreover, another score named “scale score” or “total score” is calculated based on this measure, which shows the relative solidity level of questionnaire or indeed the food insecurity level that the household suffers from.
The statistical method of item-fit in Rasch Model was used to determine the internal validity of the questionnaire. In this method, the function of every single item of the questionnaire is compared with other items and the general procedure of response giving to the questionnaire as a whole.
Item infit and item outfit are parameters, which show the observed deviation in responses given to the items of questionnaire by the household compared to estimated responses based on mathematical inferences by Rasch Model. Both are acceptable within 0.7-1.3 domain. The scores over this limit shows an incompatibility of responses given by household to the items compared with their food security level and accordingly the validity of the questionnaire (For instance positive responses to item or items with a higher severity level than that of whole questionnaire or negative answers to the items, which their severity is below the whole questionnaire).
Item discrimination is the coefficient figure in Rasch Model, which is measured based on the data provided by questionnaire. Multiplying this coefficient in item severity, questionnaire's standard deviation gets close or identical to standard questionnaire of CPS. The more this coefficient is closer to 1 the more reliability it enjoys.
RESULTS
Data presented in Tables 1 and 2 show item severity coefficient, ratio of responses given by households and item infit and outfit coefficient in adults and children's questionnaire respectively. Item discrimination figures were also shown in these tables to be 1.07 for adults questionnaire and 1.5 for children's questionnaire.
Table 1.
Item severity coefficient, the status of response by households, and indices of item-statistics in adult's questionnaire
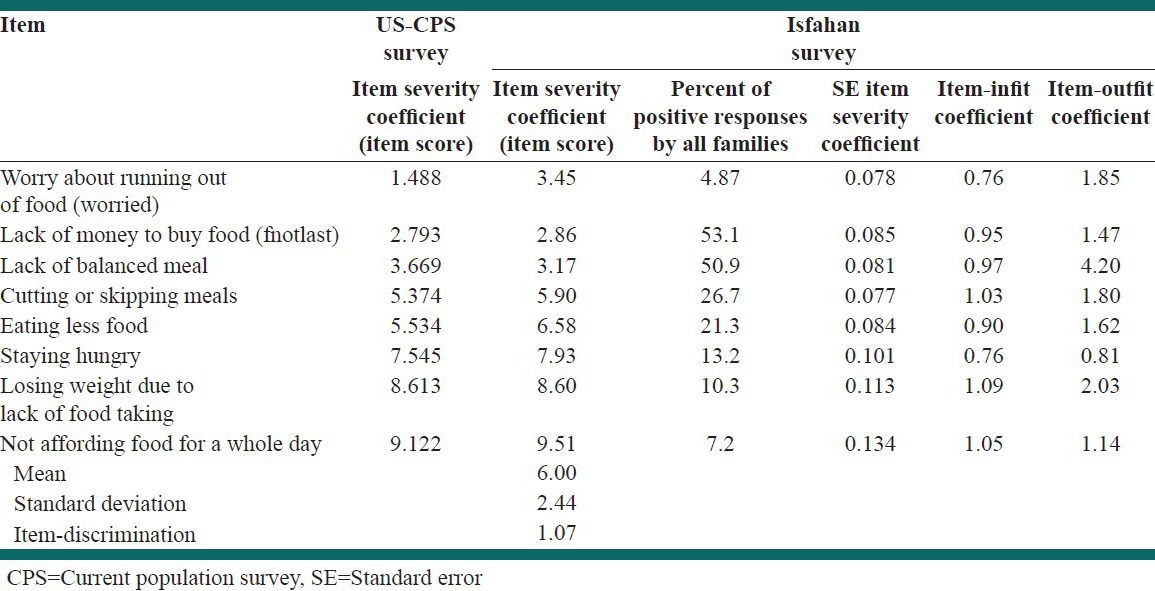
Table 2.
Item severity coefficient, the status of response by households, and indices of item-statistics in children's questionnaire
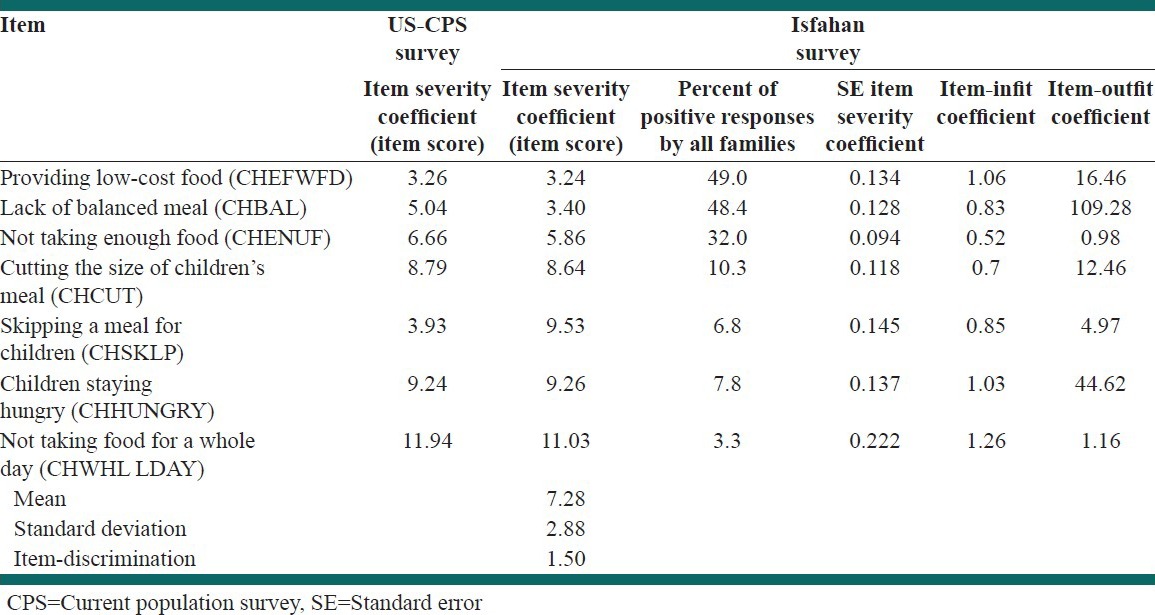
Table 3 covers the raw scores of adults and children scales which ranges from 1 to 8 and shows the number of positive responses in each scale in comparison with the real scale scores. Indeed, this score is based on the number of positive responses as well as severity of items responded.
Table 3.
Raw score and real score of household in final questionnaires of adults and children
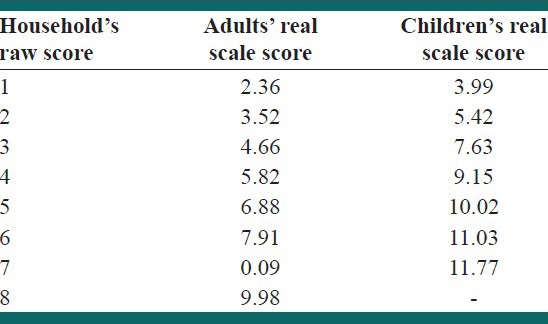
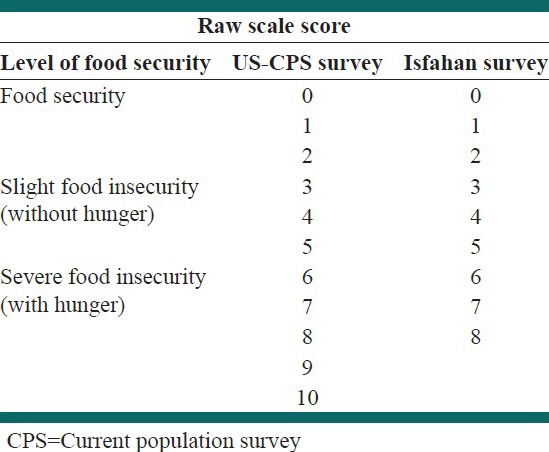
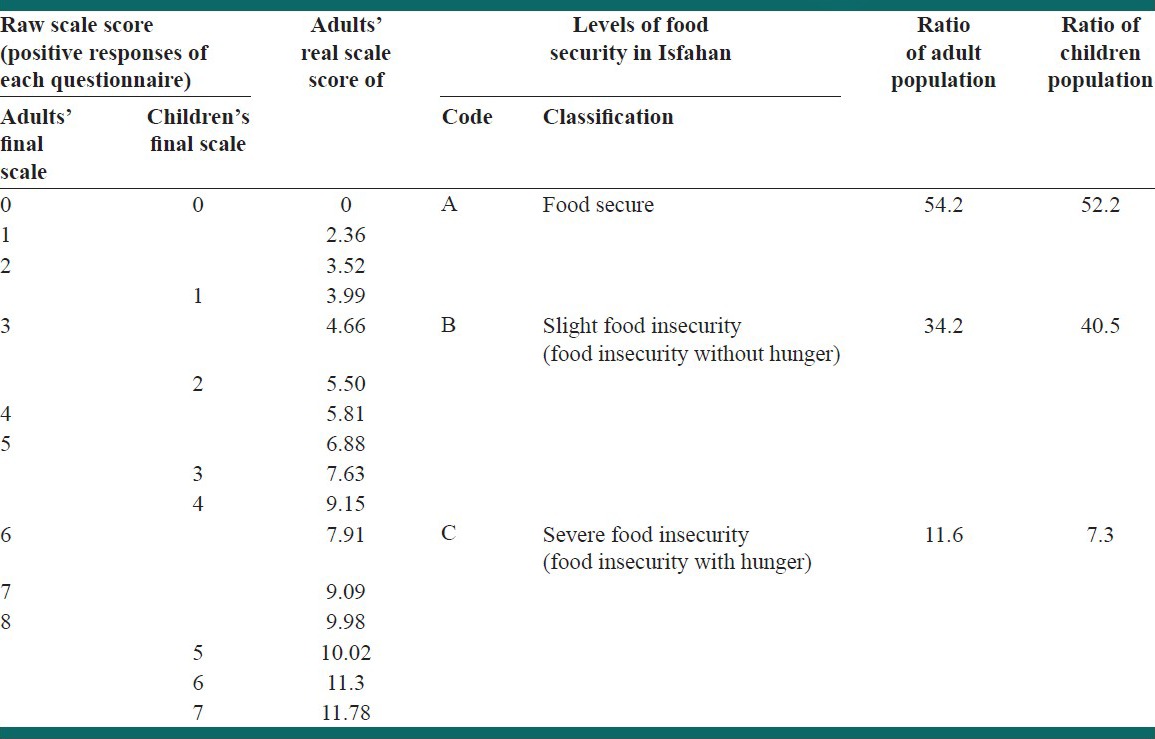
Table 4 has determined the limits and threshold of food security or insecurity using scale score or the adapted score as well as the raw scores equal to them. According to data given in this table, scale score of +3 in adults group is described as determination limit of slight food insecurity and +6 is stated as the limit for severe food insecurity. For children's group, scale score of +2 is defined to be the limit of slight food insecurity and +5 is the determination limit of severe food insecurity.
Table 4.
Categorization system of food security based on raw scale score
Ratio of population placed in each different category of food security is shown in Table 5. In this table, household food security is divided into three categories of food secure, slightly food insecure (food insecure without hunger) and severely food insecure (food insecure with hunger). According to the data of this table, 54.2% of adult population and 52.2% of child population (almost half of the study population) enjoy food security. This is while 34.2% of adult population and 40.5% of child population suffer from slight food insecurity. In addition, 11.6 of adult population and 7.3% of child population are faced with severe food insecurity.
Table 5.
Ratio of population with food security and insecurity based on real score and raw score
DISCUSSION
The main hypothesis of this survey analysis is based on raw scale score of USFSSM as a criterion for classified assessment of food security which was investigated. The results achieved in this regard are as follows:
As it is seen in Table 1, the item of “lack of enough money for buying food” (item 2) and the item of “lack of balanced meal” (3rd item) have the lowest severity coefficient. Then the ascending rate of item severity continues in first item, 4th item and keeps increasing into 10th item. This shows that except first item (and replacing it as 3rd one), scale items are categorized based on their severity or severity of food insecurity from low to high and this feature itself reveals the proper validity of the questionnaire as an instrument for assessing food insecurity. This categorization and ascending consecution of item severity from item 1 to the last item is quite visible in CPS scale in Table 1. Infit and outfit coefficient of items are calculated by Rasch statistical software and are shown in this table for all items; regarding being placed in the domain of (0.7-1.3), the validity of the questionnaire seems satisfactory. About those items having outfit coefficients higher than the domain, it could be due to anomalistic negative or positive responses to these items by one or two households (for example, a negative response to an item which should have been responded as positive according to calculations of Rasch Model or vice versa). Item discrimination calculated for adults scale is 1.07, which shows desirable reliability of scale concerning its being close to 1 (natural logistic). This coefficient is little higher than 1.5 in children's questionnaire which is due to separation of adults’ and children's questionnaires, but still stands for acceptable reliability of children's scale. It should be said that if adults’ and children's questionnaires were used as a single scale as it is in its original version (CPS), reliability of that questionnaire would fail far lower. The mentioned ascending rate of item severity in children's scale is noticeable in Table 2 as well. Based on data of Table 3, the calculated domain for item severity of final adults’ scale is from scale score of 2.36 (equal to raw score of 1) to 9.98 (equal to raw score of 7) or a domain of 6.7 points. In other words, the calculated scale score of Isfahan survey is from 2.36 (lowest item severity or food insecurity related to an item of the scale, which is the second one) to 9.98 (highest item severity or highest food insecurity related to an item of the scale, which is the sixth one). This domain ranges from 0.9 to 9.2 in US-CPS scale.[9] Moreover, according to the data represented in this table, the domain of food insecurity severity in children's scale is from 3.99 (minimum severity associated to first item) to 11.77 (associated to item 7).
Table 4 is the established threshold for limitations and boundaries of food security or insecurity.
The main discussion here is to decide on threshold score of food security or insecurity based on raw score or real score of the scale. In adults’ scale, comparison of raw scores of households shows that raw score of +3 (number of positive questions equal 3) demonstrates a relatively higher or more severe threshold and raw score of +2 demonstrates a relatively lower or less severe threshold compared to food insecurity threshold in original survey of US-CPS.[24]
On the other hand, determining a threshold for category of severe food insecurity (with hunger) is also an important issue, which is pretty discussable. As it is mentioned beforehand, the threshold and limitations and boundaries of different categories of food security is determined and established in such a level extensible for evaluative objectives and regional measurements. Therefore, as it is characterized in Table 4, if some items of CPS scale having a low infit coefficient are eliminated (as it is done in the modified scale used in this study), the threshold between + 5 and + 6 would be a more precise limit for severe food security.
Food security surveys in United States are adjusted in a manner that if anybody in a household stays hungry within a year, it will be recognized.[9] It should be mentioned that in recent food security surveys it is stated that if researchers aim to categorize food security into levels of food secure, slightly food insecure and severely food insecure they better to choose a slighter threshold compared to 4 level food security categorization which includes food secure, food insecure without hunger, food insecure with slight hunger and finally food insecure with severe hunger. Having a more moderate level, the first categorization is used more nowadays in majority of countries all over the world especially in United States.[25]
Based on what mentioned as well as the investigations about thresholds of different surveys and considering the economic, social and nutritional status of our population, the focus group of this study assigned +3 as the threshold to identify slight food insecurity and +6 as the threshold to identify severe food insecurity [Table 3].
Regarding children's scale, comparison of households raw scores in data files of the study proves that raw score of +5 as the threshold for severe food insecurity for children is a very close equivalent with its corresponding threshold in US-CPS survey.[24] In Isfahan study, considering the above mentioned points and other factors such as economic, social and nutritional status of the society, focus group of the study settled the threshold (raw score) of +2 as the limit to define slight food insecurity and +5 for describing severe food insecurity in children's scale.
According to data of Table 4, in Isfahan study 54.2% of adults enjoyed food security, 34.2% suffered from slight food insecurity (without hunger) and 11.6% suffered from severe food insecurity (with hunger). Moreover, according to the data of this table, in child population 52.2% are food secure, 40.5% are slightly food insecure and 7.3% suffer from severe food insecurity.
Statistics published by Economic Research Service of United States shows that in year 2005, 89% of American society enjoyed food security and 11% suffered from food insecurity and out of this 11%, 3.9% are severely food insecure and the remaining are slightly food insecure.[26] In Island also, where the food security survey is performed via similar CPS method, it is revealed that 75.1% of households were food secure and 24.9 were food insecure in year 2000.[27]
On the other hand, taking a quick look on nutritional status of the country within last 20 years, it could be seen that 2 changes have taken place in households’ food baskets: Firstly, the quantity and weight of this basket decreased within these years and secondly, replacements have been done for food items. In this replacement process, the weight of meat, dairies, vegetable and fruits is lessened and restored by starchy, fatty and sugared foods. In other words, under the pressure of inflations, households have survived (stayed full) gradually sacrificing proper cell nutrition. Meanwhile, it should be considered that the effect of boost in prices on food basket has not been similar among different people of the society with dissimilar incomes within a specific time in city and rural areas. As a result, major replacements in households’ food baskets are noticeable among urban and rural societies. For example, cereal consumption has increased among all income levels of urban population and on the other hand vegetable and meat consumption has decreased. These changes and replacements demonstrate the imbalance in nutritional regimen and accordingly food security deficiency in society. Other studies performed on Iranian society's food pyramid have somehow confirmed this concern and showed that the taking portion of meat, dairy, fruit and vegetable groups is lower than recommended amount and the taking portion of fat and sweet groups is very high.[28] Illustration 1 shows the status of food taking pyramid of Iranian society, which is an outcome of before mentioned study compared to standard pyramid. The noteworthy point in this pyramid is that all deficiencies in energy intake (from different nutrient groups) are compensated by excessive intake of fat and sweet groups (more than standard amount) and it demonstrates the nutritional imbalance in the population under investigation.
CONCLUSIONS
These results confirm the food security status of the society. In fact, it proves lack of food security among almost half of the society. However, some other studies on obesity prevalence, hypertension, diabetics, high blood fat and etc., performed in this society show statistically high figures for these factors among individuals of this society. For instance, obesity prevalence is reported to be (body mass index = 30 kg/m2) 40% in the population.[29] This firstly demonstrates improper distribution of economic facilities and secondly nutritional imbalance among individuals of that society and considering the over-eating phenomenon in a part of people, this cause for lack of balance and aptness in necessary nutritional intake of those people. Moreover, amplitude in some individuals resulted from excessive intake of fat and sweet food groups (7 portions daily) which leads to reduction in intake of other nutrients needed by body and finally nutritional adequacy which is a part of food security definition and nature would be eliminated. Further analysis about state and nature of food security or insecurity among each of child and adult populations and comparing with other societies evaluated through similar methods, calls for further investigations.
Footnotes
Source of Support: Esfahan University of Medical Sciences
Conflict of Interest: None declared
REFERENCES
- 1.Melgar-Quinonez HR, Zubieta AC, MkNelly B, Nteziyaremye A, Gerardo MF, Dunford C. Household food insecurity and food expenditure in Bolivia, Burkina Faso, and the Philippines. J Nutr. 2006;136:1431S–7. doi: 10.1093/jn/136.5.1431S. [DOI] [PubMed] [Google Scholar]
- 2.Guthrie JF, Nord M. Federal activities to monitor food security. J Am Diet Assoc. 2002;102:904–6. doi: 10.1016/s0002-8223(02)90202-6. [DOI] [PubMed] [Google Scholar]
- 3.Rome: FAO; 2004. Food and Agriculture Organization of the United Nations. The State of Food Insecurity in the World 2004: Monitoring Progress towards the World Food Summit and Millenum Levelopment Goals. [Google Scholar]
- 4.Ruel MT. Washington, DC: International Food Policy Research Institute (IFPRI); 2001. Can Food-Based Strategies Help Reduce Vitamin A and Iron Deficiencies? [Google Scholar]
- 5.Geneva: WHO; 1996. United Nations High Commissioner for Human Rights. All Human Rights for All. Fiftieth Anniversary of the Universal Declaration of Human Rights. [Google Scholar]
- 6.Rome: FAO; 1996. Food and Agriculture Organization of the United Nations. Food: A Fundamental Human Right. [Google Scholar]
- 7.Wolfe WS, Fron Gillo EA. Building household food security measurement tolls from the ground up. Food Nutr Bull. 2001;22:5–12. [Google Scholar]
- 8.Kaiser LL, Melgar-Quiñonez HR, Lamp CL, Johns MC, Sutherlin JM, Harwood JO. Food security and nutritional outcomes of preschool-age Mexican-American children. J Am Diet Assoc. 2002;102:924–9. doi: 10.1016/s0002-8223(02)90210-5. [DOI] [PubMed] [Google Scholar]
- 9.Frongillo EA, Chowdhury N, Ekström EC, Naved RT. Understanding the experience of household food insecurity in rural Bangladesh leads to a measure different from that used in other countries. J Nutr. 2003;133:4158–62. doi: 10.1093/jn/133.12.4158. [DOI] [PubMed] [Google Scholar]
- 10.Melgar-Quiñonez H, Kaiser LL, Martin AC, Metz D, Olivares A. Food insecurity among Californian Latinos: Focus-group observations. Salud Publica Mex. 2003;45:198–205. [PubMed] [Google Scholar]
- 11.Kaiser LL, Melgar-Quiñonez H, Townsend MS, Nicholson Y, Fujii ML, Martin AC, et al. Food insecurity and food supplies in Latino households with young children. J Nutr Educ Behav. 2003;35:148–53. doi: 10.1016/s1499-4046(06)60199-1. [DOI] [PubMed] [Google Scholar]
- 12.Lorenzana PA, Mercado C. Measuring household food security in poor Venezuelan households. Public Health Nutr. 2002;5:851–7. doi: 10.1079/phn2002377. [DOI] [PubMed] [Google Scholar]
- 13.Kaiser LL, Melgar-Quinonez H, Lamp C, Sutherlin JM, Harwood JO, Johns MC. Food insecurity and nutritional outcomes in Latino preschoolers. J Am Diet Assoc. 1999;99:A69. [Google Scholar]
- 14.Paras YP, Perez Escamilla R. El Rostro de la pobreza: Ia inseguridad alimentaria en el Distrito Federal. Revista Este Pais. 2004;158:45–50. [Google Scholar]
- 15.Melgar-Quiñonez H, Zubieta AC, Valdez E, Whitelaw B, Kaiser L. Validation of an instrument to monitor food insecurity in Sierra de Manantlán, Jalisco. Salud Publica Mex. 2005;47:413–22. doi: 10.1590/s0036-36342005000600005. [DOI] [PubMed] [Google Scholar]
- 16.Hackett M, Zubieta AC, Hernandez K, Melgar-Quiñonez H. Food insecurity and household food supplies in rural Ecuador. Arch Latinoam Nutr. 2007;57:10–7. [PubMed] [Google Scholar]
- 17.Pérez-Escamilla R, Segall-Corrêa AM, Kurdian Maranha L, Sampaio Md Mde F, Marín-León L, Panigassi G. An adapted version of the U.S. Department of Agriculture Food Insecurity module is a valid tool for assessing household food insecurity in Campinas, Brazil. J Nutr. 2004;134:1923–8. doi: 10.1093/jn/134.8.1923. [DOI] [PubMed] [Google Scholar]
- 18.Wehler CA, Scott RI, Anderson JJ. The community childhood hunger identification project: A model of domestic hunger – Demonstration project in Seattle, Washington. J Nutr Educ. 1992;24:29S–35. [Google Scholar]
- 19.Studdert LJ, Frongillo EA, Jr, Valois P. Household food insecurity was prevalent in Java during Indonesia's economic crisis. J Nutr. 2001;131:2685–91. doi: 10.1093/jn/131.10.2685. [DOI] [PubMed] [Google Scholar]
- 20.Welch KJ, Mock N, Netrebenko O. Measuring hunger in the Russian Federation using the Radimer/Cornell hunger scale. Bull World Health Organ. 1998;76:143–8. [PMC free article] [PubMed] [Google Scholar]
- 21.Frongillo EA, Nanama S. Rome: Food and Agriculture Organization of the United Nations; 2003. Development and validation of a questionnaire based tool to measure rural household food insecurity in Burkina Faso. In: Proceedings of International Scientific Symposium on Measurement and Assessment of Food Deprivation and Undernutrition; pp. 309–10. [Google Scholar]
- 22.Webb P, Coates J, Houser R. Rome: Food and Agriculture Organization of the United Nations; 2003. Challenges in defining direct measures of hunger and food insecurity in Bangladesh: Findings from ongoing fieldwork. In: Proceedings of International Scientific Symposium on Measurement and Assessment of Food Deprivation and Under Nutrition; pp. 301–3. [Google Scholar]
- 23.Fischer GH, Molenaar IW. New York: Springer-Verlag; 1995. Rasch Models: Foundations, Recent Developments, and Applications. [Google Scholar]
- 24.Rafiei M, Nord M, Sadeghizadeh A, Entezari M. Assessing the internal validity of a household survey-based food security measure adapted for use in Iran. Nutr J. 2009;8:1186–97. doi: 10.1186/1475-2891-8-28. [DOI] [PMC free article] [PubMed] [Google Scholar]
- 25.USDA Food Security Module. [Last accessed on 2008 Jul 07]. Available from: http://www.sciencedirect.com .
- 26.Nord M. USA: 2005. [Last accessed on 2013 Jul 21]. Food security in the United States Economic Research Service (ERS) Available from: http://www.ERS-USDA_Briefing_Room-Food_security_in_the_United_States.htm . [Google Scholar]
- 27.Napoli DN, Viner-Brown S. The Rhode Islan Department of Health Division of Family Health; 2001. The Rhode Islan Food Security Monitoring Project-Year 2000 Summary Report. [Google Scholar]
- 28.Ghassemi H. Tehran: National Nutrition and Food Technology Research Institute; 1998. Food and Nutrition Security in Iran: Studies of Planning and Implementation Models. Final report of research project. [Google Scholar]
- 29.Mirmiran P, Mohammadi F, Baygi F, Kalantary N, Azizi F. Assessment of dietary intake based on the food guide pyramid in a group of tehranian adults. Razi J Med Sci. 2003;9:767–78. [Google Scholar]


