
Figure 3.
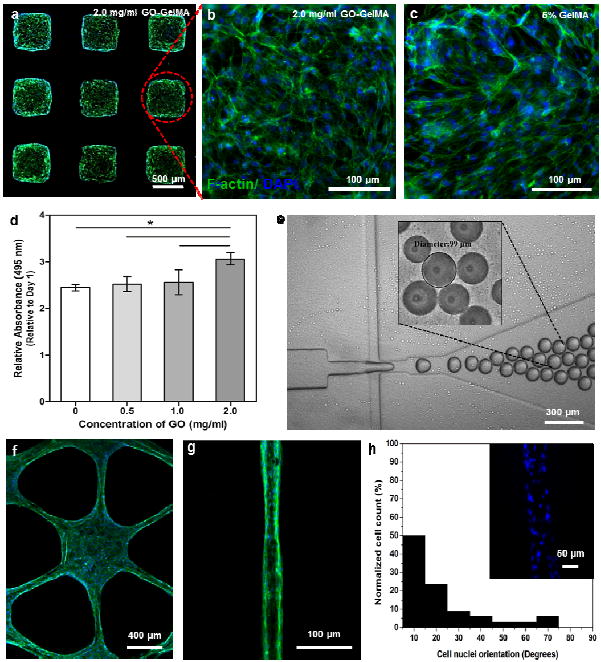
Cellular behavior of NIH-3T3 fibroblasts encapsulated in microfabricated GO-GelMA hybrid hydrogels. (a-c) Fluorescence images of cell-laden GelMA and GO-GelMA (2.0 mg/mL) microfabricated blocks. (d) Metabolic activity of encapsulated cells in microfabricated hydrogels with various GO concentrations, as quantified by MTS assay. (e) GO-GelMA (1.0 mg/mL) microspheres fabricated using a microfluidic system. Inset is a phase-contrast image of microspheres after UV crosslinking (p*<0.05). (f-g) Fluorescence images of cell-laden GO-GelMA (1.0 mg/mL) hydrogels in hexagonal and microchannel patterns. (h) Quantification of cell alignment within the GO-GelMA microchannels by Image J. Inset is a representative fluorescence image showing the orientation of cell nuclei in a microchannel. All images and the MTS assay were taken after 5 days of cell culture. For fluorescence imaging, cells were F-actin (green) and nuclei (blue) stained.