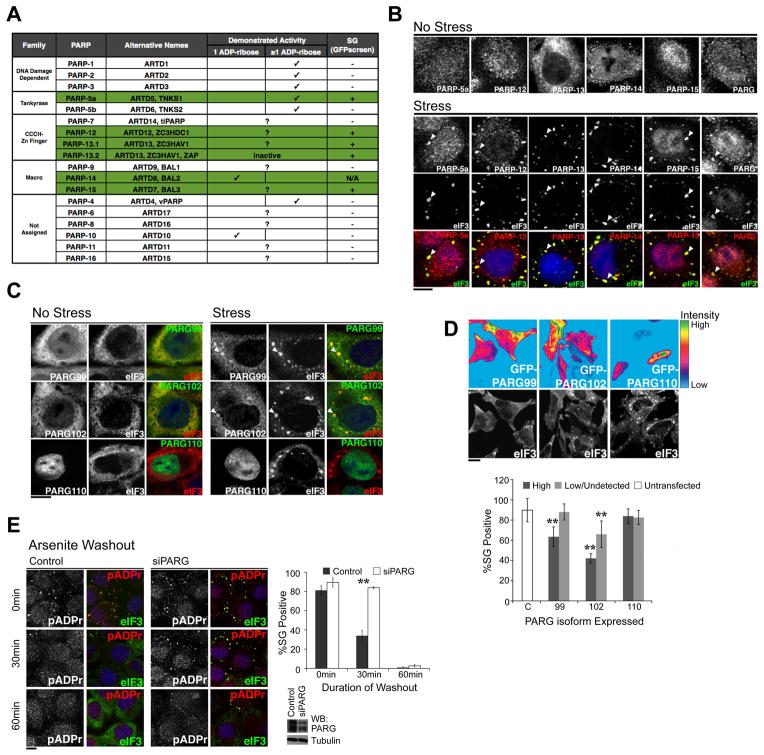
Figure 2. Specific PARPs and PARG isoforms localize in the cytoplasmic SGs and the level of PARG modulates the kinetics of SG assembly and disassembly.
(A) Summary of SG localization screen of PARP family. Green shading indicates SG-PARPs as determined by GFP-PARP fusions or PARP specific antibodies. (B) HeLa cells were treated with or without 100 μM arsenite for 60 min and stained using antibodies against SG-PARPs and PARG. (C) HeLa cells expressing GFP-tagged PARG isoforms were treated with or without 250 μM arsenite for 30 min. (D) Overexpression of cytoplasmic PARG isoforms inhibits SG assembly. Experiment performed as in panel C, but heat map shows level of GFP-PARG isoforms (99, 102, 110) compared with untransfected control (C). Accompanying graph shows quantitation of image data; ≥200 cells for each condition from at least six independent fields. Cells with GFP intensity above background are classified as ‘High’ while cells with intensity indistinguishable from background levels as ‘Low/Undetected’. Paired t-test p < 0.01 (**), derived from comparison to untransfected control; error bars indicates SD. (E) pADPr hydrolysis is required for SG disassembly. Shown are representative images taken 0, 30, and 60 min after washout of 30 min 100 μM arsenite treatment in control and PARG knockdown HeLa cells. Quantitation: ≥100 cells for each condition, n = 3. Paired t-test p < 0.01 (**) and error bars indicate SD. Accompanying blot shows level of PARG knockdown with tubulin as loading control. For panels B-E, pADPr were stained by LP96-10 antibodies, SGs (arrowheads) by anti-eIF3 and DNA by Hoechst 33342 (blue); scale bars = 10 μm. See also Figure S2 and Movie S1.

