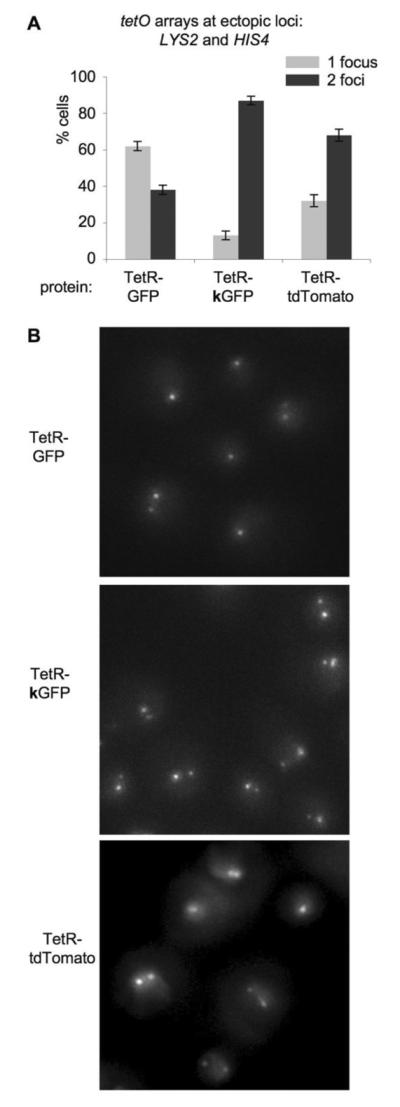
Figure 3. Microscopic analysis of cells with two ectopic tetO arrays and TetR-GFP, TetR-kGFP or TetR-tdTomato protein.

A. Quantitation of the microscopic analysis.
Percentages of cells with 1 focus and 2 foci are plotted for three strains, all of which have two tetO arrays located at HIS4 and LYS2 loci, plus one of the proteins: TetR-GFP, TetR-kGFP or TetR-tdTomato. Light grey bars – percentage of cells with 1 focus, dark grey bars – percentage of cells with 2 foci. p(1,2) = 3.45×10⁻⁵; p(1,3) = 7.3×10⁻⁴; p(2,3) = 3.38×10⁻³ (all p-values are < 0.01).
B. Representative images of cells.
In the case of cells with 2 foci, the difference in brightness of the two foci is due to the difference in the length of the two arrays (Figure 1A).
