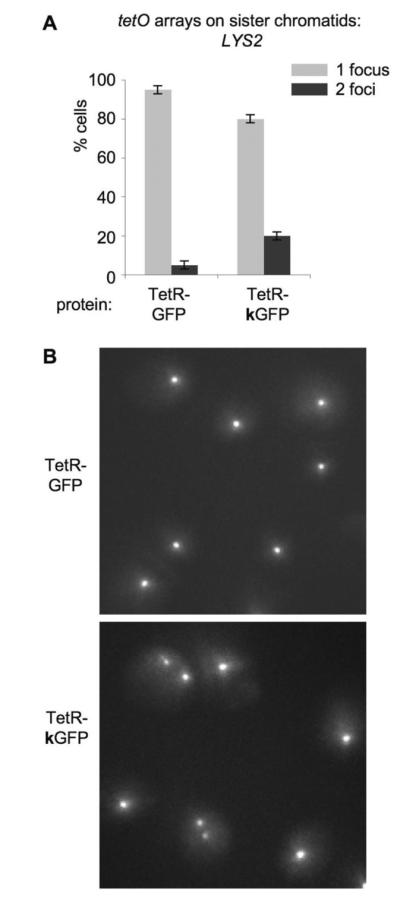
Figure 5. Microscopic analysis of G2/M-arrested cells with tetO array at LYS2 locus and TetR-GFP or TetR-kGFP protein.

A. Quantitation of the microscopic analysis.
Percentages of cells with 1 focus and 2 foci are plotted for two strains, both of which have tetO array located at LYS2 locus, plus one of the proteins: TetR-GFP or TetR-kGFP. Cells were arrested in G2/M with nocodazole, so each cells contains two sister chromatids, each of which has tetO array at LYS2. Light grey bars – percentage of cells with 1 focus, dark grey bars – percentage of cells with 2 foci. p=2.22 x10⁻³< 0.01.
B. Representative images of cells.
