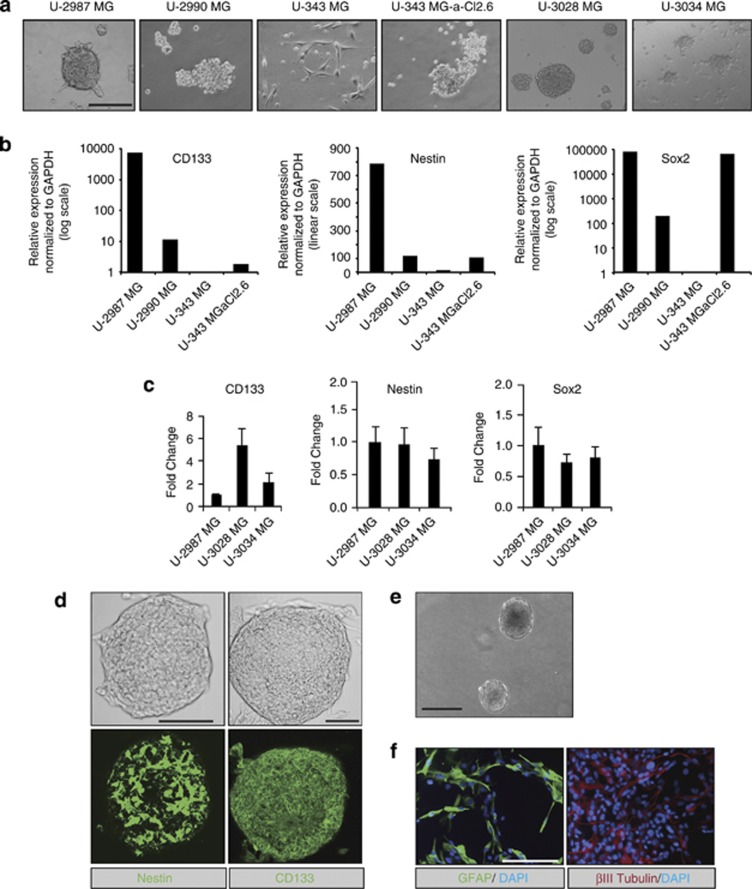
Figure 1.
In vitro stem cell properties of glioblastoma cell models. (a) Primary gliomaspheres of glioblastoma cell lines grown in stem cell media (bar: 100 μm). (b, c) Real-time qRT–PCR analysis of stem cell marker expression in the glioblastoma cells normalized to the housekeeping GAPDH. Average values from triplicates with s.d.'s are plotted in this and all subsequent qRT–PCR assays; in (b), values are normalized to U-343 MG cells, whose expression is set to 1; in (c) values are normalized to U-2987 MG cells. (d) Confocal microscopy on primary U-2987 MG gliomaspheres showing phase contrast images (top) and Nestin or CD133 immunofluorescence (bottom; bar: 50 μm). (e) Phase contrast image of U-2987 MG secondary gliomaspheres (bar: 100 μm). (f) GFAP, βIII tubulin and DAPI staining of glioblastoma cells after dissociation and differentiation from individual secondary U-2987 MG gliomaspheres (bar: 100 μm).

