
Figure 2.
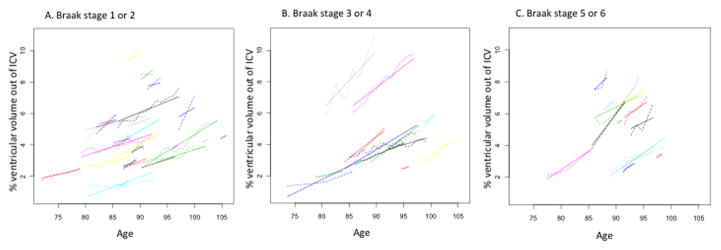
Trajectories of ventricular volume change. Dotted lines represent the predicted trajectories based on estimates using the coefficients generated in the mixed effects models and solid lines represent the observed trajectories.
Figure 2 A, B and C show trajectories for the three Braak groups: Braak none, 1 or 2 (A), Braak 2 or 3 (B), Braak 5 or 6 (C).