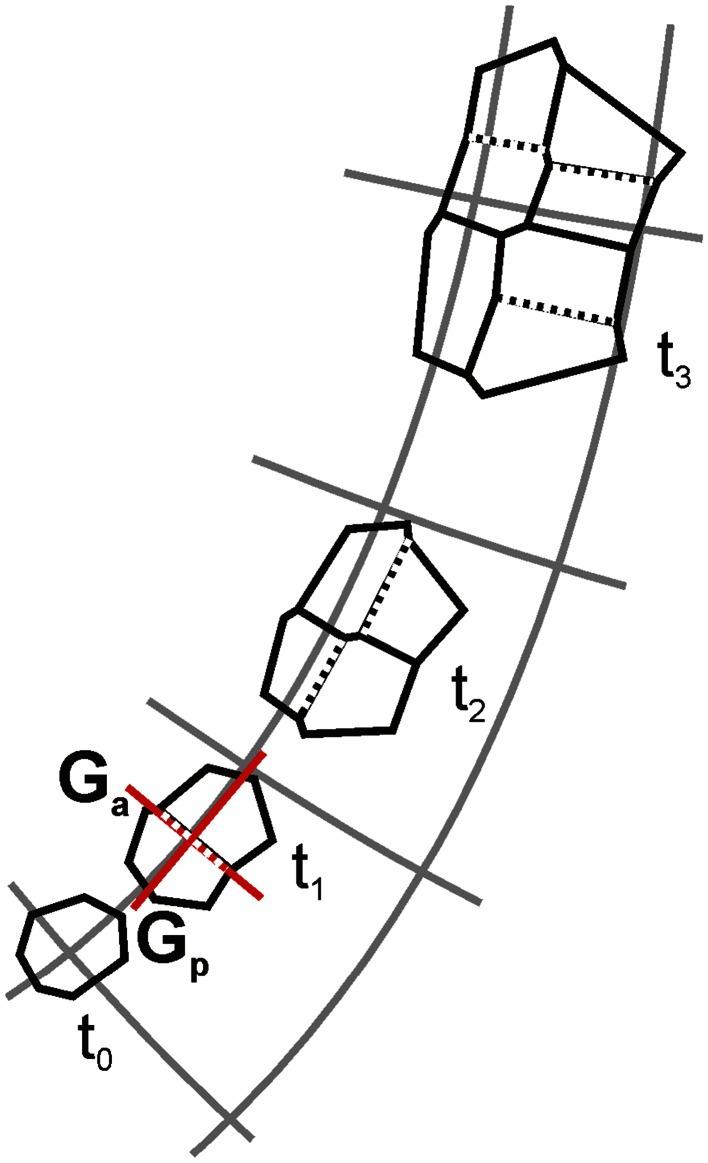
Fig. 3.
The computer-generated sequence illustrating algorithm of the 2D tensor-based model for growth in which cells divide with respect to PDGs, gray lines represent PDG trajectories. From the cell assumed at t 0 the whole cell packet is obtained at t 3; notice how the cell packet position changes with respect to the pattern of PDG trajectories. Cells enlarge and divide when critical value of their area is exceeded. The division wall can be perpendicular either to G a or G p (red) but the direction that gives division by the shorter wall is chosen, all newly formed walls are indicated by dashed lines. After formation, the new wall is diminished a little, causing a redefinition of angles in points of its attachment

