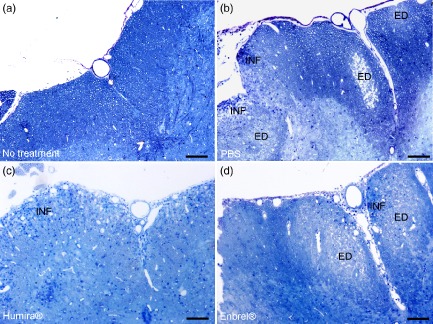
Figure 3.

Light-microscopic analysis of spinal cord histopathology in anti-tumour necrosis factor (TNF)-α-treated mice. C57BL/6 mice were immunized with MOG:35–55, treated with phosphate-buffered saline (PBS) (n = 4), Humira® (n = 3) or Enbrel® (n = 4) and killed on day 20 post-immunization. Spinal cords were removed carefully from the vertebral canal, epon-embedded and semi-thin sections of the lumbar part were obtained. (a–d) Representative images of non-immunized control mice (a) and PBS- (b), Humira®-(c) or Enbrel®-treated MOG:35–55-immunized mice (d). The scale bar denotes 100 μm. ED = oedema; INF = blue dots represent immune cells infiltrating the central nervous system (CNS).
