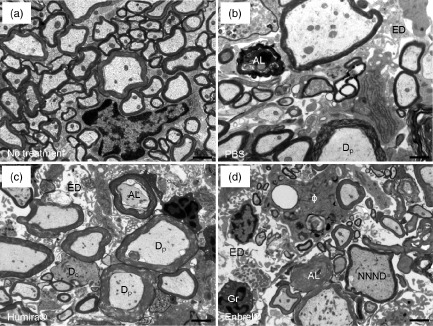
Figure 4.

Ultrastructural analysis of spinal cord histopathology in anti-tumour necrosis factor (TNF)-α-treated mice. Mice were immunized and treated as described in Fig. 3. After epon-embedding, ultrathin sections of the lumbar spinal cord of non-immunized control, phosphate-buffered saline (PBS)-, Humira®- and Enbrel®-treated mice were obtained and assessed by electronmicroscopy. Representative images are shown in (a–d). The scale bar depicts 1 μm. AL = axolysis; ED = oedema; Dc = demyelinated nerve fibre; Dp = nerve fibre in the process of demyelination; Gr = granulocyte; Φ = macrophage with myelin debris in the cytoplasm; NNND = nerve fibre with decreased nearest-neighbour neurofilament distance indicating axonal pathology.
