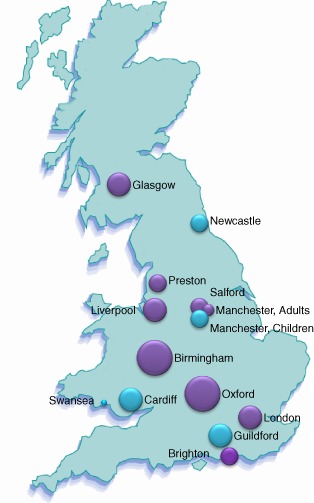
Figure 2.

Distribution of responses from UK centres. The locations of the 14 centres across the United Kingdom are shown and the sizes of the circles are proportional to the numbers of data sets from each centre. Purple circles show centres returning adult patient data and blue where data from children were also submitted.
