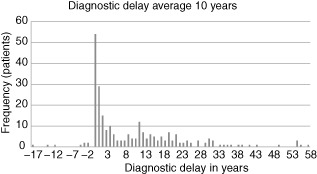
Figure 4.

Diagnostic delay. Diagnostic delay is shown with the number of years from the onset of symptoms to the time of diagnosis on the x-axis and the frequency in numbers of patients on the y-axis. Where patients have negative values this is due to a diagnosis being made before the onset of symptoms, usually because the diagnosis had been made previously in another family member, which was the case in 3·2% of the 249 patients.
