
Figure 5. Increase of the number of colonies per cm2 and the number of cells per colony in the culture of SSEA-4(+) cells.
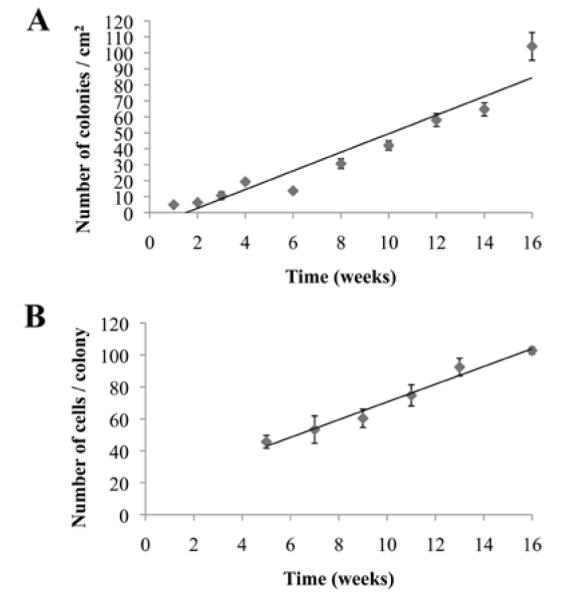
(A): The number of colonies was counted in 3 wells of a 24-well dish before passaging and the mean average and standard deviation were calculated. (B): The number of cells was counted on a hematocytometer after enzymatic passaging of colonies. The mean average and standard deviation were calculated by the cell numbers on three 4X4 grids of the hematocytometer.