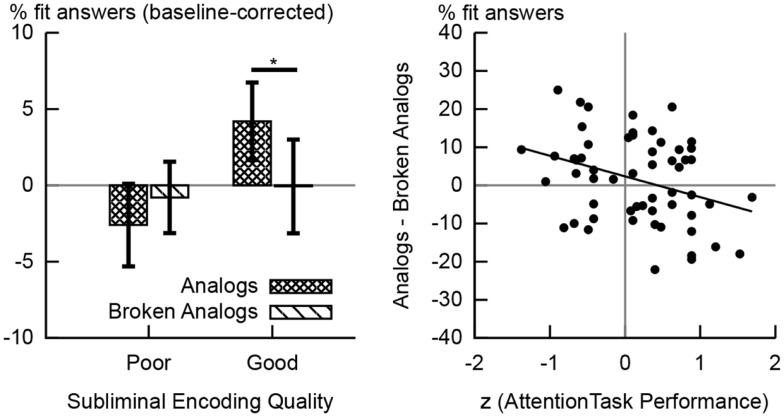
Figure 3.
Behavioral results. The left-hand chart shows the percentages of fit responses given to analogs and broken analogs by the group of good and the group of poor subliminal encoders. These percentage values are baseline-corrected; i.e., the percentage of fit responses given to control word pairs was subtracted. Error bars indicate standard errors of means. The difference in the percentage of fit responses to analogs versus broken analogs reached significance at the 5% level in good subliminal encoders. The right-hand chart shows the scatter plot of the correlation between performance on the attention task (during subliminal encoding) and unconscious analogy detection at test (difference in the percentage of fit responses to analogs versus broken analogs). A poorer performance on the attention task predicted a better performance at detecting analogies (R = −0.332,p = 0.012).

