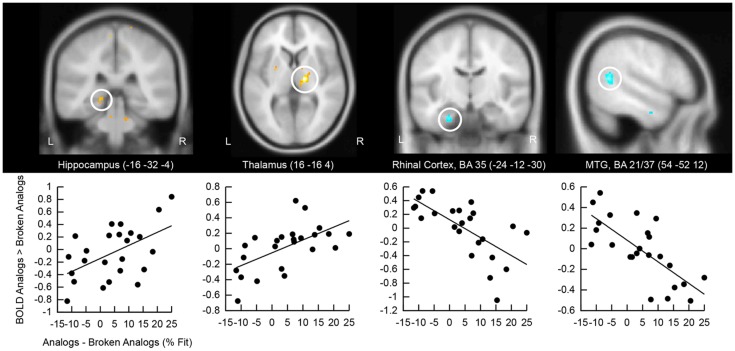
Figure 5.
Correlation of retrieval-related brain activity with analogy detection at test. The location of the cluster of voxels, where correlations reached significance, is shown on anatomical brain images. BA, Brodmann area; MTG, middle temporal gyrus. Scatter plots of these correlations are presented below brain images. The first eigenvariate of the cluster of significantly correlating activity is displayed in arbitrary units on the y-axis. The difference in the percentage of fit responses to analogs versus broken analogs is displayed on the x-axis. All data come from good subliminal encoders (N = 24; data collapsed over Encoding Intensity).

