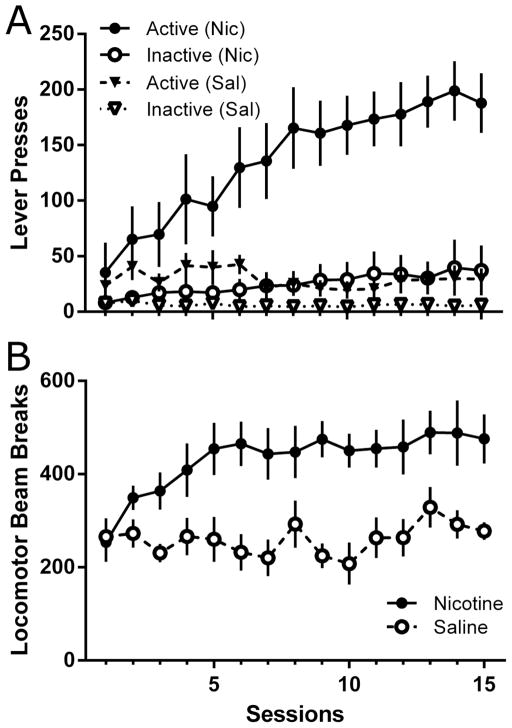
Figure 1.
Total responses on each lever and locomotor activity across the 15-session VS-reinforcer maintenance phase of Experiment 1. Lever pressing data (Panel A) from the nicotine and saline conditions are represented as circles or triangles, respectively. Filled shaped represent active lever pressing, whereas open shapes represent inactive lever pressing. Locomotor activity data (Panel B) is represented as filled circles for the nicotine condition and as open circles for the saline condition. All data presented as mean ± SEM.

