
Figure 3.
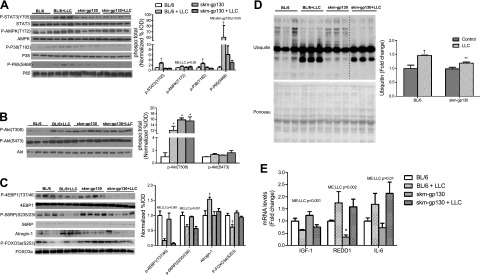
Effect of skm-gp130 on LLC-induced signaling. A) Western blot analysis of p-STAT3, total STAT3, p-AMPK, total AMPK, p-p38, total p38, p-NF-κB (p-p65), and total NF-κB protein expression. Ponceau staining verified equal loading. B) Western blot analysis of p-Akt (T308), p-Akt(S473), and total Akt. C) Western blot analysis of the mTOR signaling proteins p-4EBP1, total 4EPB1, p-S6, total S6, p-FOXO3, total FOXO3, and atrogin. Ponceau staining verified equal loading. B, C) Graphs represent the ratio of phosphorylated to total protein levels. D) Levels of ubiquitinated proteins were quantified by Western blot analysis, with equal loading verified by Ponceau stain. Dashed line indicates different sections of the same gel. E) Skeletal muscle mRNA expression of IGF-1, REDD1, and IL-6 was measured in the gastrocnemius. All values are means ± se. Two-way ANOVA was used to analyze the effect of skm-gp130 and LLC. *P < 0.05 vs. BL/6 control; **P < 0.05 vs. BL/6 LLC; †P < 0.05 vs. all other groups.