Figure 2.
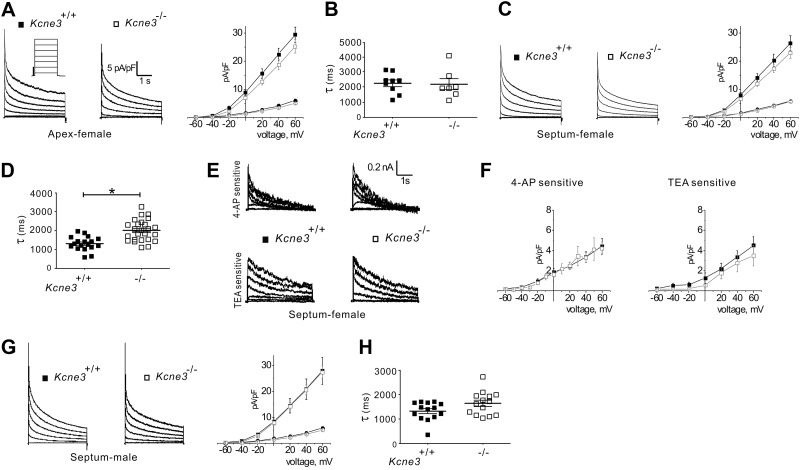
Kcne3 deletion has minimal effects on isolated ventricular myocyte K+ currents. A) Left panel: representative current traces recorded from myocytes isolated from the ventricular apex of female Kcne3+/+ and Kcne3−/− mice as indicated. Whole-cell outward K+ currents were evoked during 4.5-s depolarizing voltage steps to potentials between −60 and + 60 mV with an INa-inactivating prepulse, from a holding potential of −70 mV (protocol inset). Right panel: mean I/V relation for peak (squares) and end-of-pulse (circles) currents recorded from myocytes as at left; n = 13–15 cells/genotype. B) Mean IK,slow inactivation τ at +40 mV for apex myocytes as in A, n = 13–15 cells/genotype. C) Left panel: representative current traces recorded from Ito,f-expressing myocytes isolated from the ventricular septum of female Kcne3+/+ and Kcne3−/− mice; other parameters as in A. Right panel: mean I/V relation for peak (squares) and end-of-pulse currents (circles) recorded from myocytes as at left; n = 24–26 cells/genotype. D) Mean IK,slow inactivation τ at +40 mV for septal myocytes as in C, n = 24–26 cells/genotype. *P < 0.01. E) Representative digitally subtracted, 4-AP- and TEA-sensitive current waveforms recorded from septal myocytes isolated from female Kcne3+/+ and Kcne3−/− mice. F) Mean I/V relationships for drug-sensitive currents as in E; n = 4–13 myocytes/genotype. G) Left panel: representative current traces recorded from Ito,f-expressing myocytes isolated from the ventricular septum of male Kcne3+/+ and Kcne3−/− mice; other parameters as in A. Right panel: mean I/V relation for peak (squares) and end-of-pulse currents (circles) recorded from myocytes as at left; n = 22–23 cells/genotype. H) Mean IK,slow inactivation τ at +40 mV for septal myocytes as in G; n = 22–23 cells/genotype.

