Figure 3.
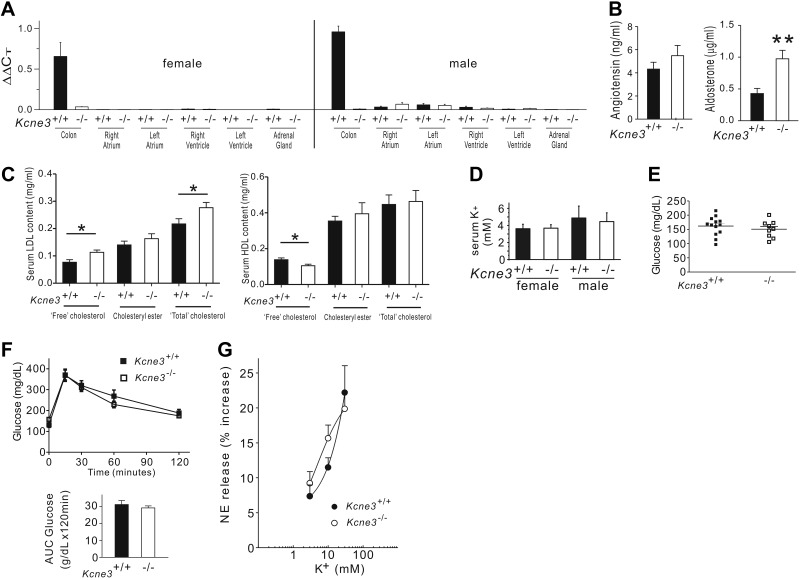
Kcne3 deletion causes hyperaldosteronism and hypercholesterolemia. A) Mean Kcne3 transcript expression (by real-time qPCR) in colon, 4 chambers of the heart, and adrenal glands of female and male Kcne3+/+ mice, with similar analysis of Kcne3−/− tissue as a negative control; n = 3 mice/genotype. B) Left panel: mean serum angiotensin II concentration of Kcne3+/+ and Kcne3−/− mice (n=15–18/genotype); P = 0.30 between genotypes. Right panel: mean serum aldosterone concentration of Kcne3+/+ and Kcne3−/− mice (n=9/genotype). **P = 0.003 vs. Kcne3+/+. C) Mean serum LDL (left panel) and HDL (right panel) content of male Kcne3+/+ (n=8) and Kcne3−/− (n=10) mice. *P < 0.05 vs. Kcne3+/+. D) Mean serum K+ concentrations for 8-mo-old Kcne3+/+ (n=7–8) and Kcne3−/− (n=4–6) mice. E) Mean blood glucose content of 7-mo-old Kcne3+/+ (n=13) and Kcne3−/− (n=9) mice. F) Left panel: mean blood glucose concentrations during glucose tolerance test of 7-mo-old Kcne3+/+ (n=13) and Kcne3−/− (n=8) mice. Right panel: area under the curve (AUC) for glucose values from data at left. G) Concentration-response curves for the NE-releasing effects of K+ in synaptosomes isolated from Kcne3+/+ and Kcne3−/− mouse hearts. There were no significant differences between the curves. Points are means (n=7 for each point in each curve) of increases in NE release above a basal level of 0.8 ± 0.1 pmol/mg (mean±se; n=14/genotype).

