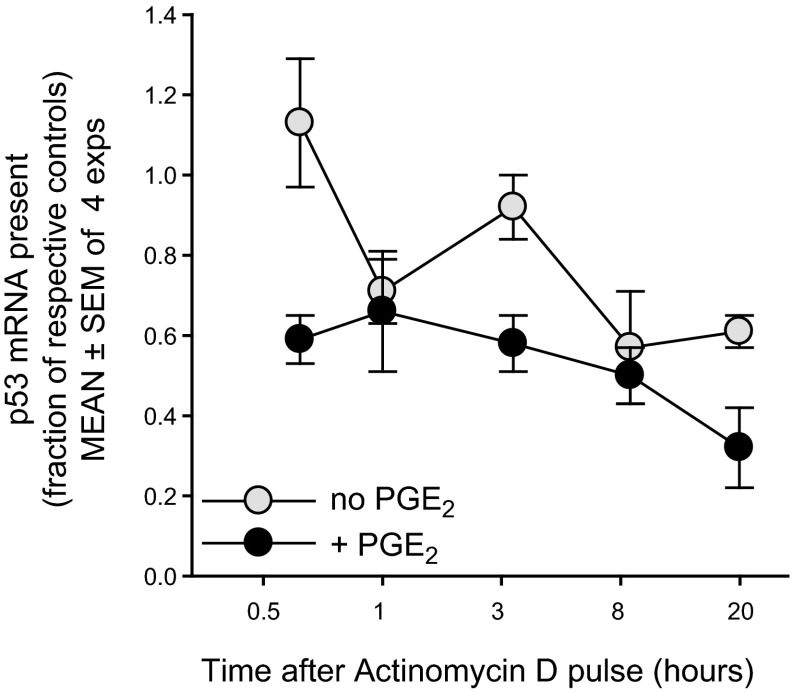
Figure 6.
PGE2-promoted rise in p53 mRNA is not explained by PGE2-induced mRNA stabilization. In order to assess whether p53 mRNA stability was affected by a pulse of exogenous PGE2, sets of replicate cultures were pulsed with PGE2 (50 nM) or vehicle alone. After 8 h of additional culture (for peak PGE2-induced elevation in p53 mRNA; Fig. 3), a series of replicates within each of the above subsets received actinomycin C (5 μM) or DMSO vehicle. RNA was isolated at varying time points after the actinomycin D or DMSO (0.5, 1, 3, 8, and 20 h). q-PCR of cDNA measured p53 transcript levels in each culture, expressed as a fraction of that present in the respective PGE2-untreated or PGE2-treated cultures with DMSO vehicle (means±se of 4 experiments). Dotted line represents the normalized level of transcript present in cultures with or without PGE2 but without actinomycin D. Data were statistically analyzed (see Materials and Methods) to compare mean fold change of p53 mRNA between PGE2-pulsed and nonpulsed cultures to their respective controls across time after actinomycin D. There was no significant interaction between time and presence of PGE2 (P<0.72), indicating that the slope of p53 mRNA expression after actinomycin D (mRNA decay) was not significantly different with or without PGE2. Nevertheless, when the interaction term was removed from the model, the main effects of cell type and time were significant. Cells without PGE2 supplement had a significantly greater p53 mRNA, relative to their controls, as compared to those pulsed with PGE2 (P<0.0001). Overall, p53 mRNA expression decreased over time for all cells relative to controls (P<0.0002). Taken together, these experiments show that the elevated p53 mRNA levels in PGE2-prepulsed cultures do not reflect diminished degradation of the p53 transcript.

