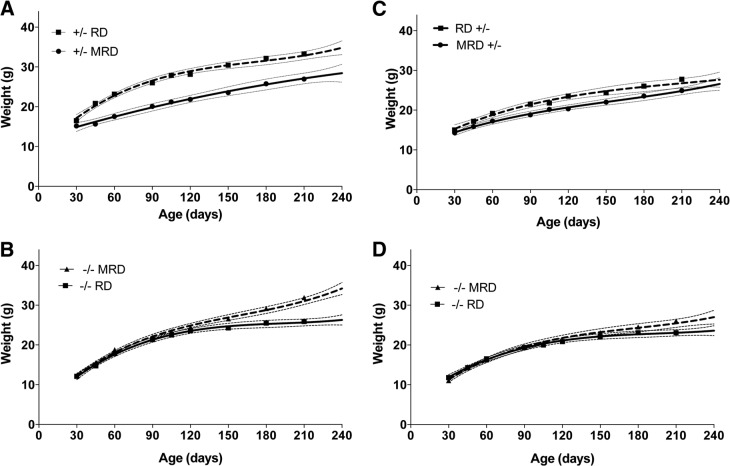
Figure 2.
Comparison of the effects of RD and MRD stratified by genotype. A) Comparison of growth curves of male Cbs+/− mice fed the RD (hatched line, n≥12 for each point) vs. MRD (solid line, n=7). The symbol at each time point shows the mean weight, with the error bars showing the 95% confidence interval of each curve. B) Comparison of growth curves of male Cbs−/− mice fed the RD (solid line, n≥8) and the MRD (hatched line, n=10). C) Comparison of growth curves of female Cbs+/− mice fed the RD (hatched line, n≥12) vs. the MRD (solid line, n=9). D) Comparison of growth curves of female Cbs−/− mice fed the RD (solid line, n≥13) and MRD (hatched line, n=9).

