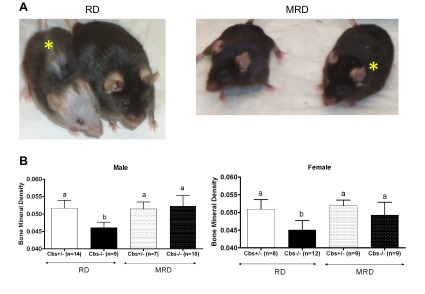
Figure 6.

Correction of alopecia and osteoporosis phenotypes of Cbs−/− animals by MRD. A) Photo on the left shows 240-d-old mice fed the RD; photo on the right shows animals of the same age fed the MRD. Animal marked with the yellow asterisk is the Cbs−/− animal; the other animal in each photo is a sibling Cbs+/− animal. B) BMD of male and female Cbs−/− and Cbs+/− mice fed the RD and MRD as determined by DEXA. All graphs show means ± sd. Significant differences between columns are indicated by different letters at the top of the error bar; a single common letter indicates nonsignificance.
