Figure 2.
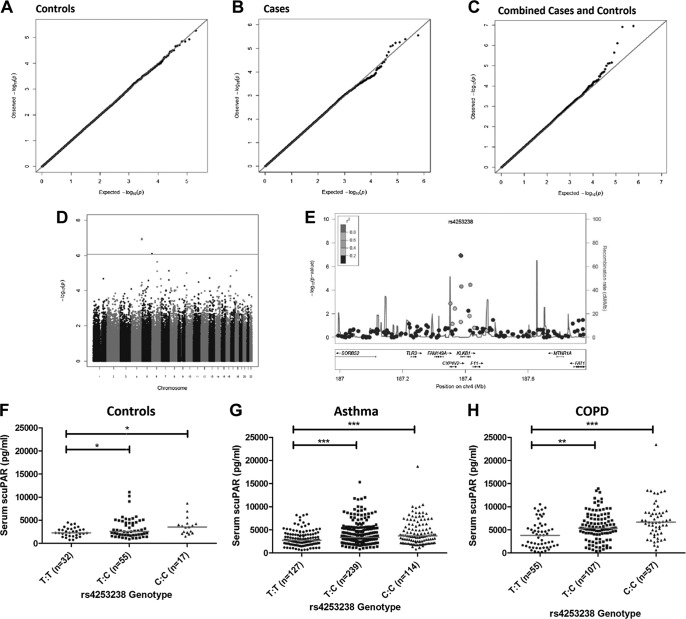
Serum scuPAR is associated with the KLKB1 SNP rs4253238. A, B) QQ plot for genome-wide analyses in control (n=104; A) and asthma (n=480; B) populations. The QQ plots identify a modest deviation in the disease (asthma) population. C) In an analysis of the asthma and control populations (n=584), the QQ plot reveals that measured SNP log P values deviate significantly from the expected trend denoted by the red trend line. D) Manhattan plot identifies a single region as the genome-wide significant in a combined asthma/control population analysis (P=1.69×10⁻⁷). This region contains 2 SNPs (rs425328 and rs1912826) that lie in the intergenic space between the genes KLKB1, FXI, and CYP4V2. E) Region plot investigation identifies SNP rs4253238 as the main associated SNP in this region, with supporting evidence. F–H) Analysis of the relationship bewween rs4253238 and serum scuPAR in the COPD cohort (n=219; H) reveals that the same direction of effect exists across the control (F) and asthma (G) populations. These differences were statistically significant (P<0.001). Red lines denote median scuPAR levels. *P < 0.05, **P < 0.001, ***P < 0.0001.

