Figure 2.
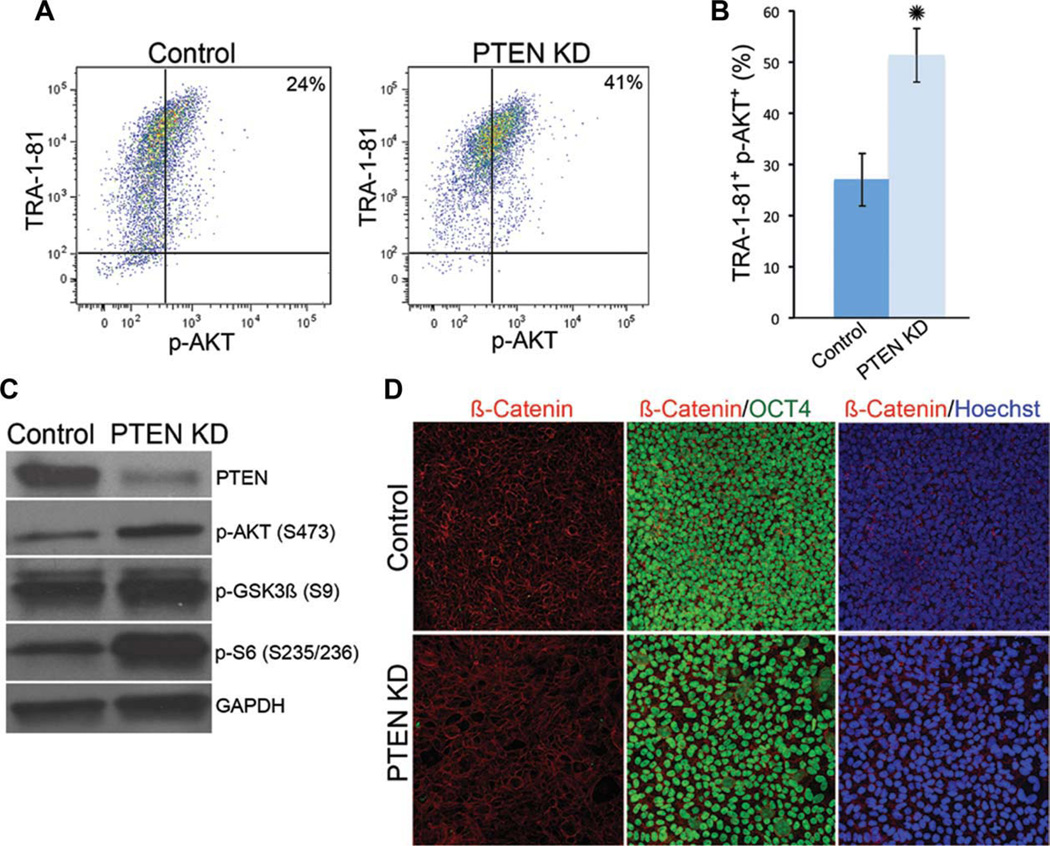
Signaling downstream of PTEN KD in human embryonic stem cells (hESCs) includes activation of AKT and S6, but not β-catenin. (A): FACS plots showing the percentage of TRA-1-81-positive hESCs that are positive for p-AKT S473. (B): Quantification of FACS analysis in (A). (C): Western blot analysis of PTEN, p-AKT, phospho-GSK3β (p-GSK3β S9), and phospho-S6 (p-S6S235/236) protein levels in control and PTEN KD hESCs. (D): Immunofluorescent staining of β-catenin (red), OCT4 (green), and Hoechst (blue) shows similar membrane localization of β-catenin in control and PTEN KD hESCs. Experiments were performed using control and PTEN KD passage 40–45 hESCs. FACS plot, immunofluorescent staining, and Western blots are representative of three independent experiments. Error bars represent standard error of three independent experiments and asterisks denote a p value <.05. Abbreviations: FACS, fluorescence-activated cell sorting; GAPDH, glyceraldehyde-3-phosphate dehydrogenase; GSK, glycogen synthase kinase; PCR, polymerase chain reaction; p-AKT, phospho-AKT; PTEN KD, PTEN knockdown.

