Figure 4.
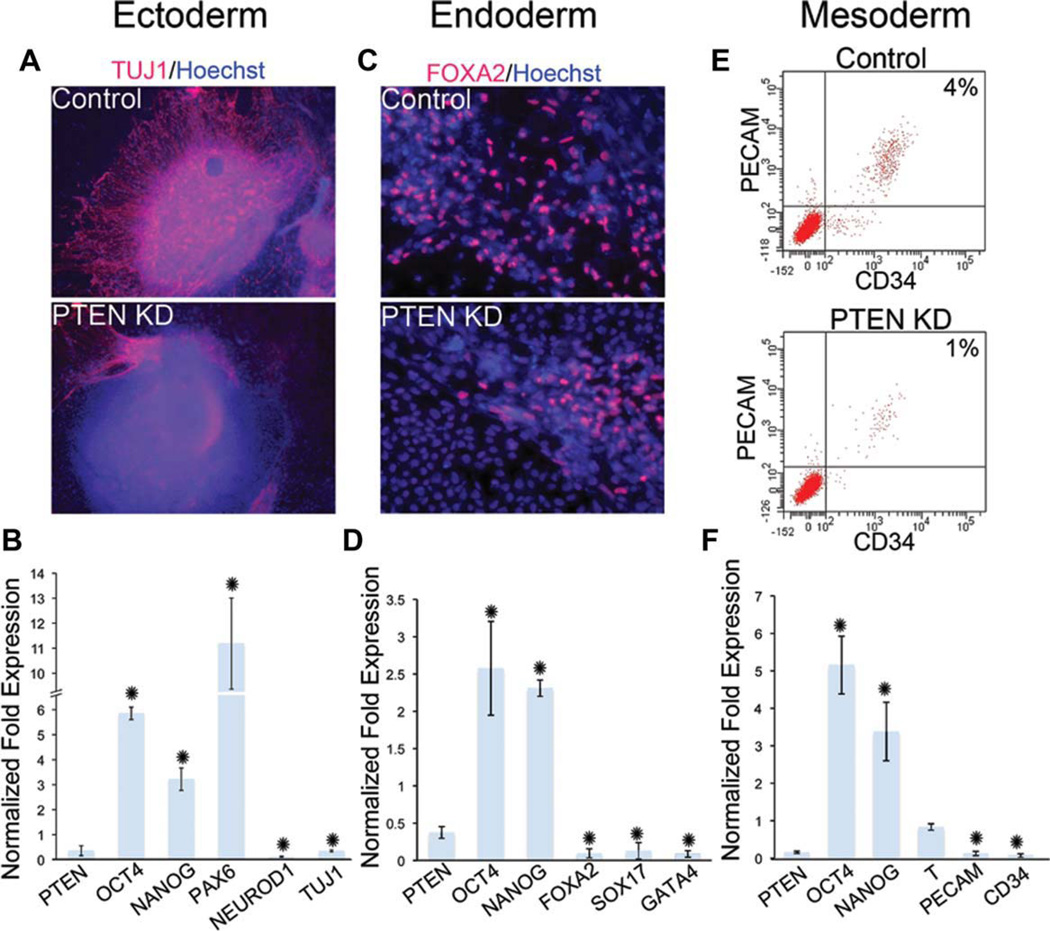
PTEN KD human embryonic stem cells (hESCs) have a decreased potential to differentiate into late-stage neuroectoderm, and early and late-stage endoderm and mesoderm. Control and PTEN KD hESCs were differentiated into neural (A, B), endoderm (C, D), and mesoderm (E, F) lineages. (A): Immunofluorescent staining of TUJ1 (red) and Hoechst (blue) after neural directed differentiation of control and PTEN KD differentiated cells. (B): Quantification of the experiment in (A) using qPCR of neuroectoderm markers PAX6, NEUROD1, and TUJ1. (C): Immunofluorescent staining of FOXA2 (red) and Hoechst (blue) after endoderm differentiation of control and PTEN KD differentiated cells. (D): Quantification of the experiment in (C) using quantitative PCR (qPCR) of endoderm makers FOXA2, SOX17, and GATA4. (E): FACS analysis of PECAM and CD34 expression in control and PTEN KD cells after mesoderm differentiation. (F): Quantification of the experiment in (E) using qPCR of mesoderm markers, BRACHYURY (T), PECAM, and CD34 in PTEN KD cells relative to control. qPCR graphs show expression of PTEN KD cells relative to control cells. In all differentiation experiments, the pluripotency genes, OCT4 and NANOG, remain highly expressed in PTEN KD cells. All experiments were performed using control and PTEN KD passage 37–45 hESCs. Immunofluorescent staining and FACS analysis are representative of three independent experiments yielding similar results. qPCR graphs represent data from three independent experiments. Error bars represent standard error and asterisks denote p values <.05. Abbreviations: FACS, fluorescence-activated cell sorting; FOXA2, forkhead box A2; NEUROD1, neurogenic differentiation 1; PCR, polymerase chain reaction; PECAM, platelet/endothelial cell adhesion molecule; PTEN KD, PTEN knockdown.

