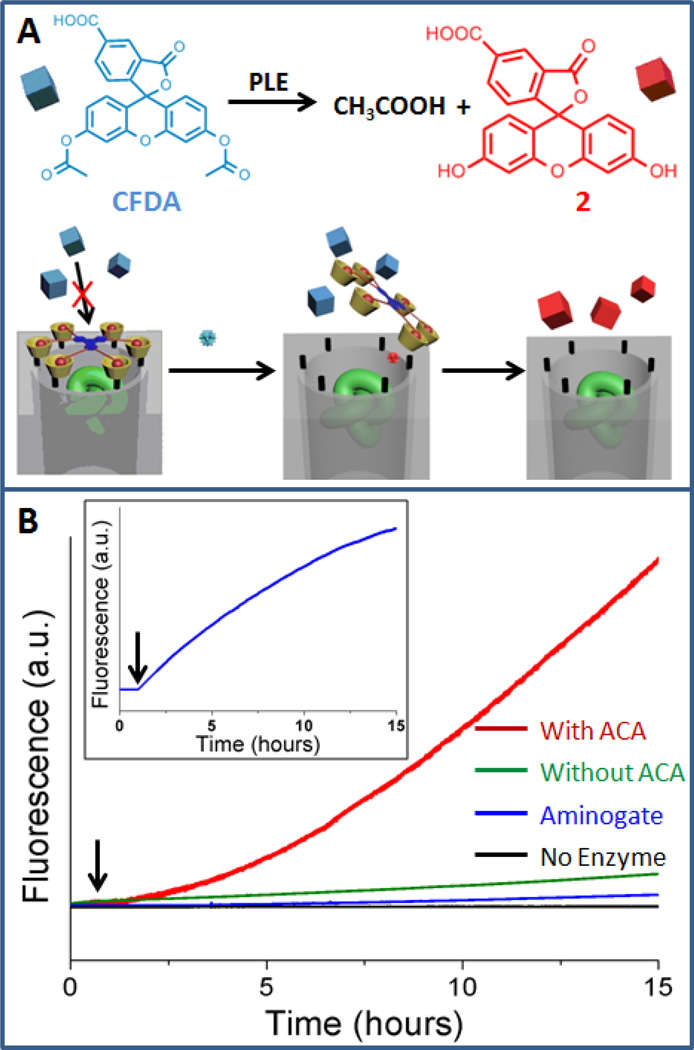
Figure 3.
A) Illustration of the operation of the amplifier. B) Normalized fluorescence profiles of hydrolyzed CFDA in the presence of enzyme-encapsulated silica nanoparticles in different experiments: with the addition of ACA analyte (red curve), no ACA (green curve), no enzyme in the particles (black curve), and the amino-version of the nanogate (blue curve). Insert: the corresponding fluorescence profile of the hydrolyzed analyte for the experiment with ACA. The arrows indicate when ACA was added.

