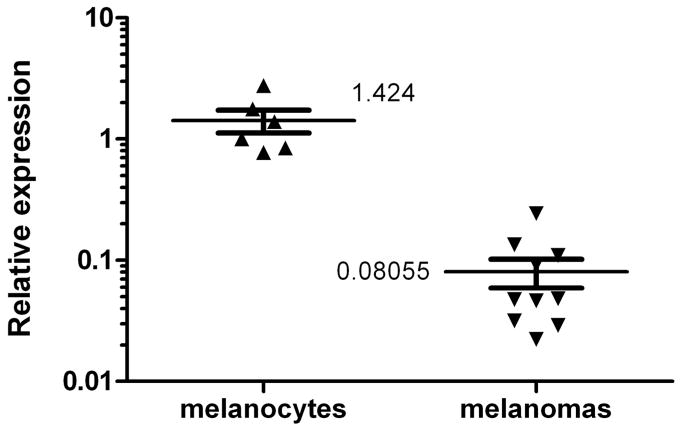
Figure 1.
Scatter plot of qRT-PCR results for miR-26a expression showing melanocytes vs. melanoma cell lines. Melanocytes include two different primary melanocyte lines (HEMNLP and HEMNLP2) at different passages and with different culture conditions (with or without FBS). Melanomas include 10 different established cell lines under standard culture conditions (see Materials and Methods for a list of cell lines). All results were normalized to RNU1A as an internal standard, and denote relative expression compared to one of the melanocyte lines set at 1.0. Melanoma lines had an average of 17.7-fold less miR-26a compared to melanocytes, p < 0.0001.

