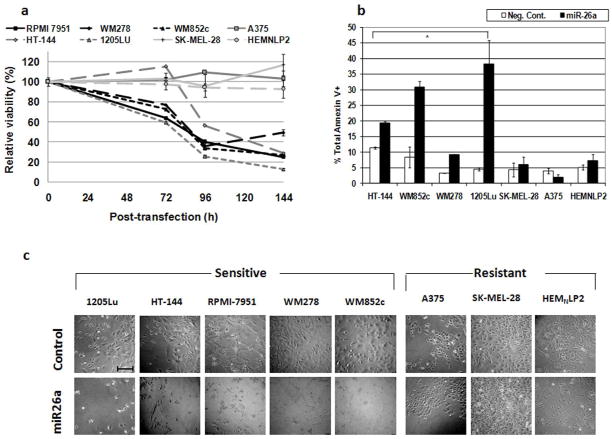
Figure 2.
Treatment with miR-26a mimic induces cell death in several melanoma cell lines. (a) Time-course MTS assays for cells transfected with 50 nM miR-26a mimic. Results for each cell line at each time point represent the viability of cells transfected with miR-26a mimic as a percentage of those transfected with negative control. Error bars represent SEM of at least 3 replicates. See Results section for statistical significance. (b) Annexin V assays of cells transfected with 50 nM miR-26a or negative control for 96 h. * p-values < 0.05 for comparisons between miR-26a mimic and negative control cells. Error bars represent SEM of at least 2 independent experiments. (c) Visual appearance of cells after 96 h of treatment. Scale bar in top left image = 0.5 mm.

