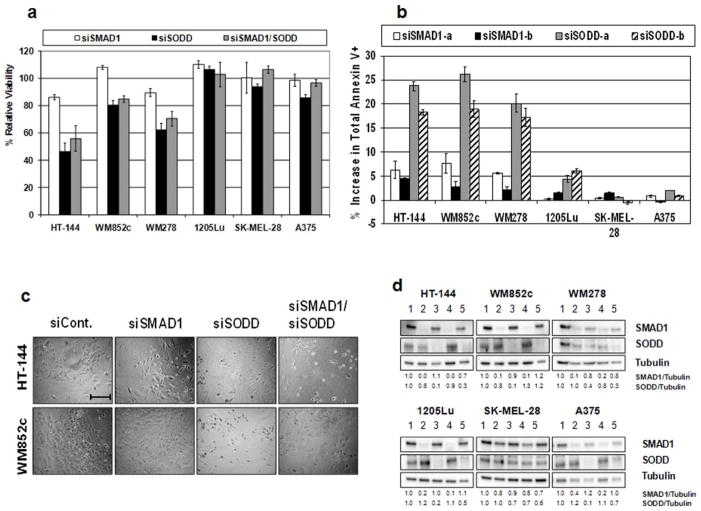
Figure 4.
The effects of knocking-down SODD. (a) MTS assays after 120 h treatment with 25 nM total siRNA normalized to the control. Shown are results using siSMAD1-a and siSODD-a; similar results were found for the other two siRNAs (not shown). Error bars represent SEM of 3 replicates. (b) Annexin V assay results after 120 h treatment with 25 nM siRNA normalized to the control. Y-axis represents the increase in the percentage of total Annexin V positive cells compared to negative control transfected cells. Error bars represent SEM of at least 2 independent experiments. (c) Visual appearance of cells from (a). Scale bar = 0.5 mm. (d) Immunoblots of siRNA-treated-cells from (b). Lane 1, control; lanes 2/4, siSMAD1 (-a and -b); lanes 3/5, siSODD (-a and -b).

