Figure 5.

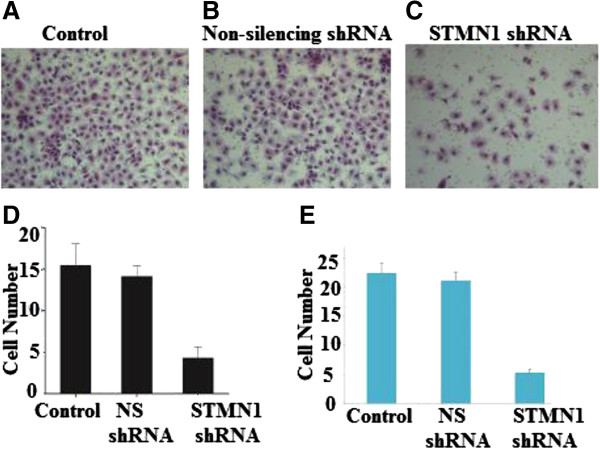
Effects of STMN1 knockdown on cell migration and invasion. The images of cells migrating PVPF filters as examined by cell migration assay using Boyden chambers. Cell migration was evaluated in the Boyden migration assay two days after Esophageal cancer cells were either (A) untreated or (B) transfected with Non-silencing shRNA or (C) stathmin1 siRNA. (D) Representing average of STMN1 shRNA infected cells, Non-silencing shRNA infected cells and non-infected cells (P < 0.05) versus control. (E) The average invading cell counts of STMN1 shRNA infected cells, Non-silencing shRNA infected cells and non-infected cells. Data are expressed as percentage change (Means ± S.D.) compared with controls and represent four independent experiments. (P < 0.05 vs Non-silencing shRNA, one-way analysis of variance (ANOVA) followed by Tukey’s multiple comparion).
