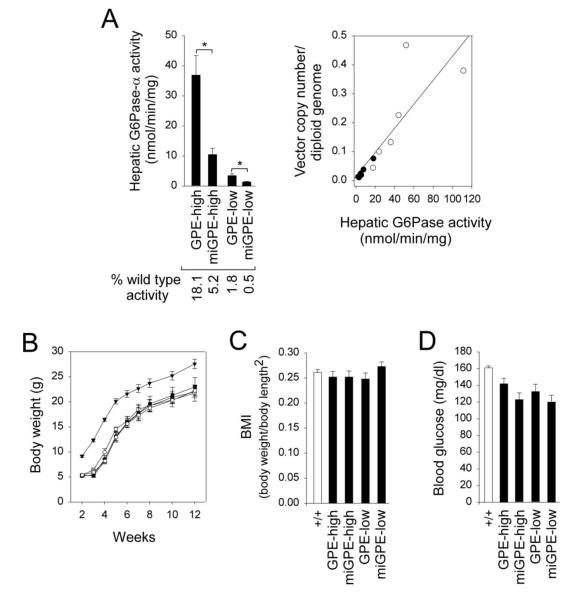
Fig. 1.
Biochemical analyses in 12-week-old wild type and rAAV8-treated G6pc−/− mice. (A) Hepatic microsomal G6Pase-α activity and its relationship to vector genome copy numbers. (B) Growth curve. (C) BMI values. (D) Blood glucose levels. GPE-high, high dose rAAV8-GPE-treated (○); miGPE-high, high dose rAAV8-miGPE-treated (●); GPE-low, low dose rAAV8-GPE-treated (□); miGPE-low, low dose rAAV8-miGPE-treated (∎) G6pc−/− mice; (+/+), wild type (▾) mice. Hepatic G6Pase activity represents the combined data from the two centers (n = 12 per treatment) and the other data are from the NIH (n = 6 per treatment). Data are mean ± SEM. *P < 0.05.

