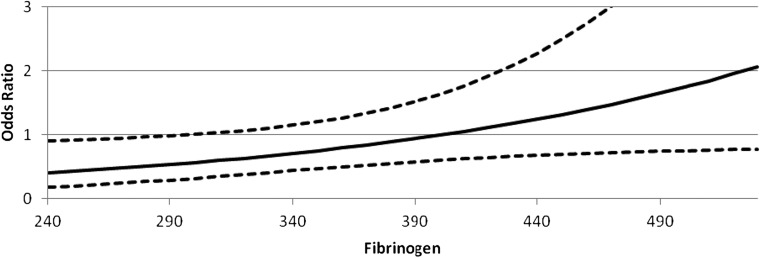
Figure 1.
The solid line represents the point estimate of the treatment ORs at various levels along the x-axis that ranges from the minimum to the maximum observed value, while the dotted lines represent the 95% CIs. INT was associated with decreased progression of retinopathy in those with fibrinogen <296 mg/dL (OR 0.55 [95% CI 0.31–1], P = 0.0347).

