
Figure 5. Identification of S4F in the PCa and Stromal Compartments.
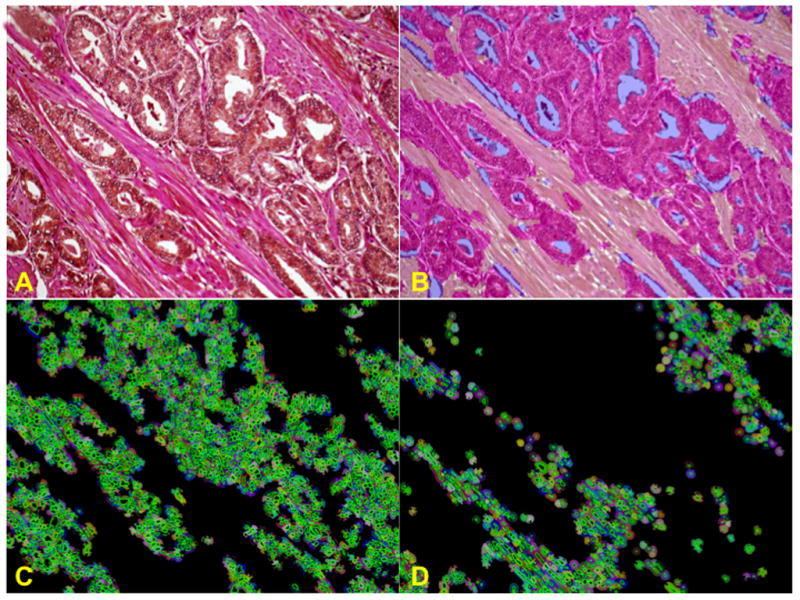
A cohort tissue microarray was stained, imaged and analyzed using image deconvolution (Nuance) and segmentation (InForm). This permits separation of compartments within the tumor (PCa vs. stroma). Individual cells are then recognized within the PCa and stroma and analyzed for nuclear vs. cytoplasmic stain. Figure 5A shows S4F immunohistochemistry with DAB and Hematoxylin & eosin as background stain. Image is difficult to interpret with the naked eye. Figure 5B shows the segmentation of the PCa from the stroma. Figure 5C shows each individual nuclei only in the PCa, circled in green, surrounded by their individual cytoplasm. Figure 5D shows the same exclusively for cells in the stromal component. S4F expression levels for individual cell data per compartment was then quantified and used for subsequent correlation and survival studies.