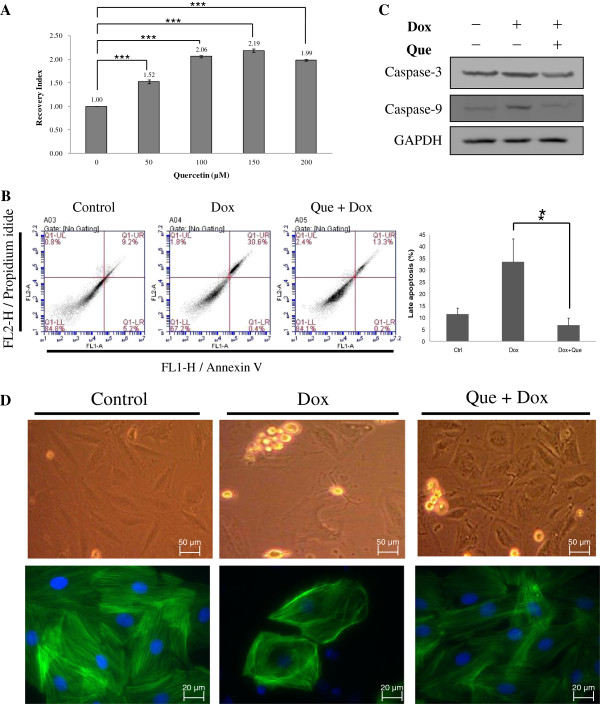
Figure 2.
Effects of quercetin on doxorubicin-induced changes of cell viability, cell apoptosis and cell morphology in H9C2 cells. (A) MTT-based viability assays were performed on H9C2 cell cultures following treatments with different concentrations of quercetin (50 μM, 100 μM, 150 μM and 200 μM) or left untreated. Values were normalized against untreated samples and were the average of 4 independent measurements +/- the standard deviation. The statistic analysis was performed with two group paired Student t-test. (B) Typical dot plot diagrams detected annexin V-FITC and PI staining represent untreated, doxorubicin-treated, and quercetin-pretreated followed by doxorubicin–treated cells. The x-axis and y-axis stand for the intensity of annexin V-FITC and PI, respectively. The lower left area of presented background staining by annexin V-FITC and PI in normal cells, and apoptotic signals located in the right area. This figure is representative of 4 replicates. The statistic analysis of the replicates was listed in right panel. (C) The levels of caspase 3 and caspase 9 in H9C2 cells were detected by immunoblotting. GAPDH served as a sample loading control. (D) Cell morphology and protein location of F-actin in H9C2 cells were analyzed by immunostaining. H9C2 cells on coverslips were either left untreated, treated with doxorubicin or pre-treated with quercetin prior to doxorubicin treatment before fixation and staining. F-actin was stained with phalloidin and nuclei were stained with DAPI. Each set of five fields were taken using the same exposure and images are representative of five different fields. In (B) ~ (D), H9C2 cells were untreated, 0.45 μM of doxorubicin for 24 h, or 100 μM of quercetin for 4 h followed by 0.45 μM of doxorubicin for 24 h.

