Figure 3.
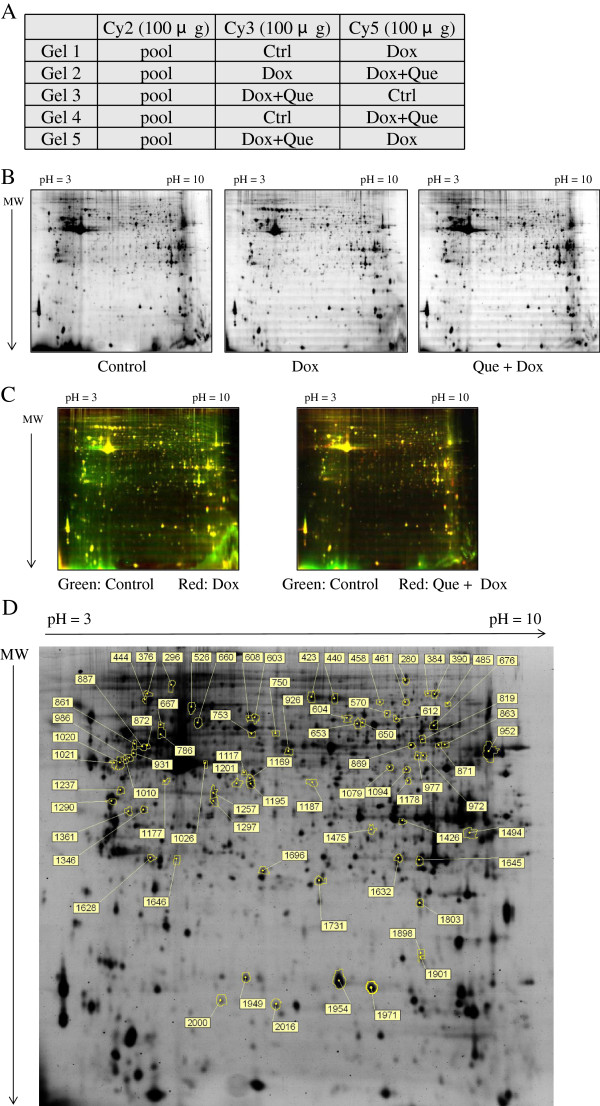
2D-DIGE analysis of H9C2 cells in response to doxorubicin treatment and pre-treatment with quercetin. (A) Samples arrangement for a triplicate 2D-DIGE experiment. (B) Protein samples (100 μg each) were labeled with Cy-dyes and separated using 24 cm, pH 3-10 non-linear IPG strips. 2D-DIGE images of the protein samples from H9C2 cells in response to doxorubicin treatment and pre-treatment with quercetin at appropriate excitation and emission wavelengths were shown as well as overlaid pseudo-colored images processed with ImageQuant Tool (GE Healthcare) (C). (D) Protein samples (100 μg each) purified from total cell lysates were labeled with Cy-dyes and separated using 24 cm, pH 3-10 non-linear IPG strips. The differentially expressed protein features were annotated with spot numbers. In this 2D-DIGE experiment, H9C2 cells were untreated, 0.45 μM of doxorubicin for 24 h, or 100 μM of quercetin for 4 h followed by 0.45 μM of doxorubicin for 24 h.

