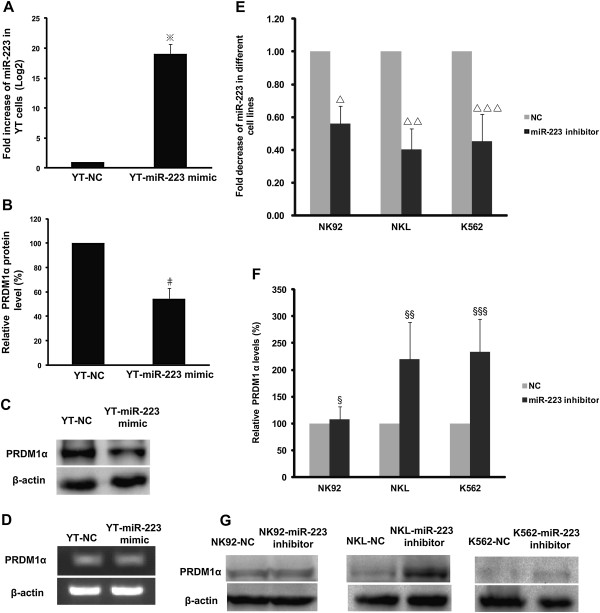
Figure 7.
Endogenous PRDM1 protein expression is affected by increased miR-223 or decreased miR-223. A miR-223 mimic or mimic negative control (NC) was transfected into YT cells by electroporation. (A) qRT-PCR analysis revealed a significantly increased level of miR-223 in YT cells transfected with miR-223 mimic compared to NC. The results were confirmed in 3 independent experiments with data presented as mean ± SE (※P < 0.001). (B) Western blot showed that PRDM1α protein level was markedly diminished (54.44% relative to YT-NC, normalised to β-actin) in YT cells transfected with miR-223 mimic. YT-NC was adjusted to 100%. Results were quantified by densitometry in 3 independent experiments (mean ± SD) (#P = 0.008). (C) A representative image of PRDM1α protein expression in YT cells as detected by western blot. (D) RT-PCR and agarose gel electrophoresis showed ectopic expression of miR-223 with no effect on PRDM1α transcript. NK92, NKL, and K562 cells were transfected with miR-223 inhibitor or NC with HiPerFect Transfection Reagent. (E) Compared to NC, the level of endogenous miR-223 was significantly decreased in NK92, NKL, and K562 cells by qRT-PCR analysis. The data are presented as mean ± SE of 4 independent experiments (∆P = 0.026, ∆∆P = 0.017, and ∆∆∆P = 0.044). (F) Semi-quantitative analysis by densitometry demonstrated that the PRDM1α protein was restored to 220% and 234% by miR-223 inhibition in NKL and K562 cells, respectively, compared to NC, but the level of PRDM1α protein in NK92 cells was not significantly affected. The data are presented as mean ± SD of 4 independent experiments (§P = 1.000, §§P = 0.040, and §§§P = 0.022). (G) Representative western blot images of PRDM1α protein levels in NK92, NKL, and K562 cells are shown.

