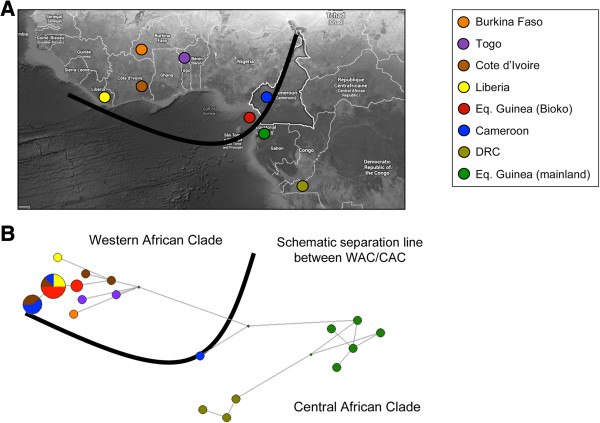
Figure 3.
Geographic representation of the COI haplotypes. A) Geographic distribution of the COI lineages; B) Haplotypes network derived from 30 haplotypes of the G. p. palpalis complex. Haplotypes are represented by circles and their frequency is proportional to the area. Network diagrams created using Phylogenetic Network software from Fluxus and using the Median Joining method as described previously [47].

