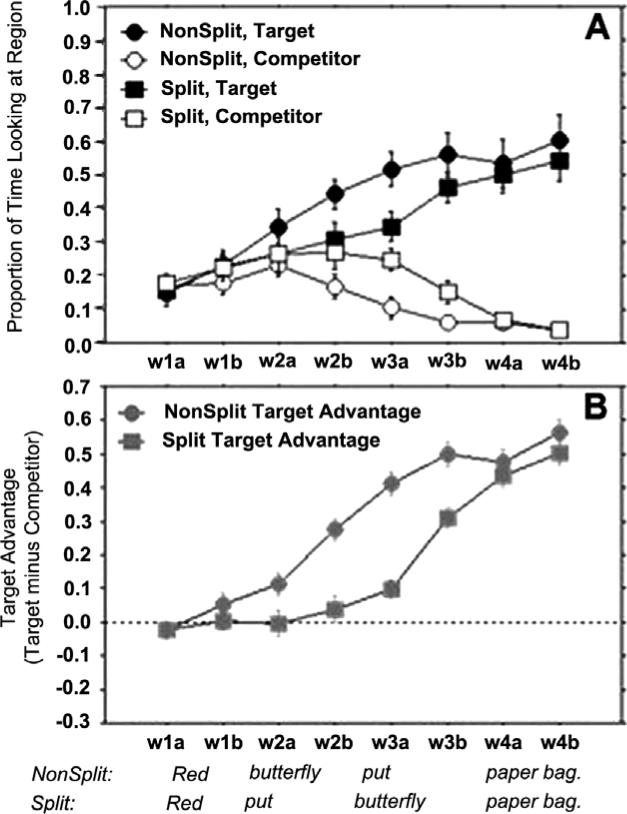
Figure 2.
Panel A: The proportion of time spent looking at the Target (filled symbols) and the Competitor (open symbols) in response to NonSplit (circles) and Split (squares) constituents. Panel B: Target advantage scores, i.e., the proportion of time spent looking at the Target minus the proportion of time spent looking at the Competitor. (Plotted are subject means, with 95% confidence intervals.)

