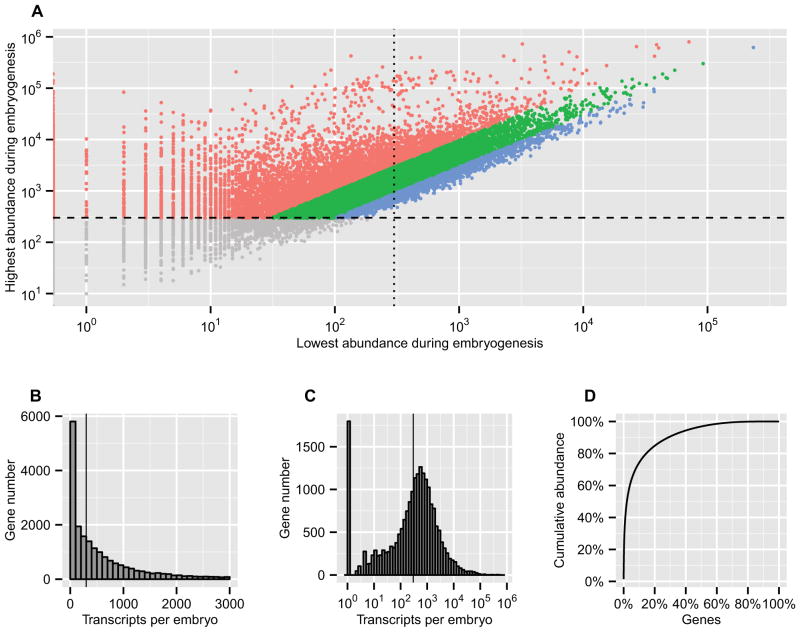
Figure 2.
Various distributions of transcript abundance. (A) The highest and lowest transcript abundance for each gene during embryogenesis. The ordinate is the highest and the abscissa is the lowest transcript abundance. The ordinate cutoff (>300 transcript per embryo, horizontal dashed line) defines whether a gene has been expressed: the upper colored dots are the embryonic gene repertoire; the lower gray dots are genes which are below threshold. The abscissa cutoff (vertical dotted line) defines whether a gene has been continuously expressed: the dots on the right side represent the embryonic housekeeping genes, and the dots on the left side represent the genes whose transcript levels are very low at one or more time points. The diagonal color layers indicate the ratio between the highest and lowest transcript abundance: the blue dots represent genes expressed at constant levels with the fold less than 3; the red dots represent genes expressed at dynamic levels varying more than 10 fold. (B, C, D) Distributions of transcript abundance in the 24 hpf embryo. (B) Linear histogram of transcript abundance showing between 0–3000 transcripts per embryo. The vertical line represents 300 transcripts per embryo. (C) Log histogram of transcript abundance. All values were shifted up by 1 so that non-expressed genes (the bar at 100) can be made visible on the log plot. The vertical line represents 300 transcripts per embryo. (D) Cumulative abundance.

