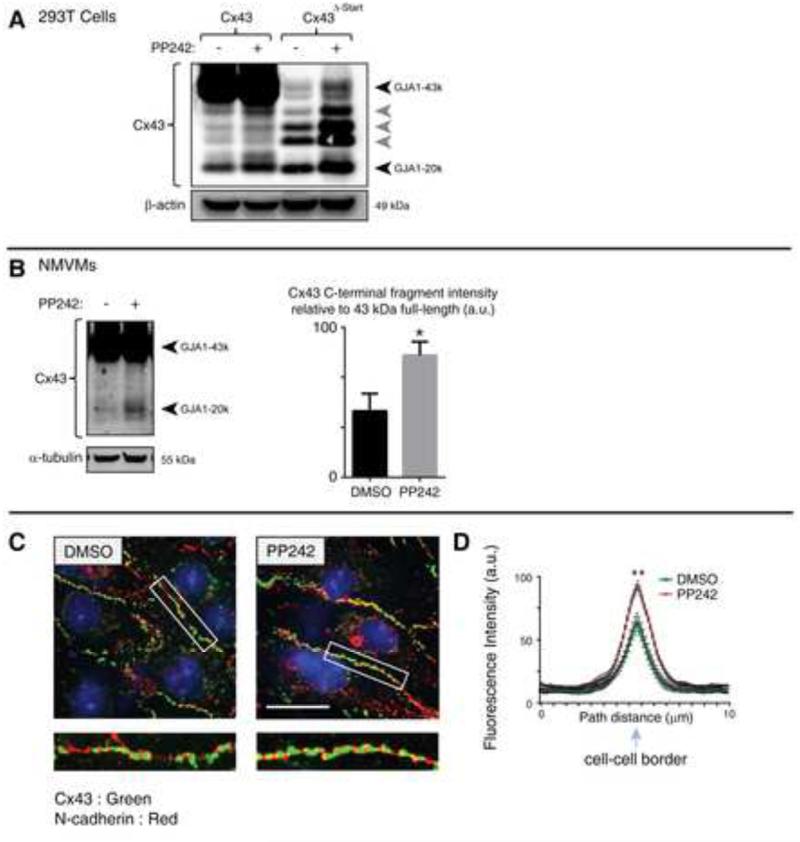
Figure 4. Expression of C×43 truncated isoforms is regulated by the mTOR pathway.
(A) 293T cells transfected with siRNA-resistant C×43 or C×43ΔSTART with knockdown of endogenous C×43 incubated for 8 h in the presence or absence of the mTOR kinase inhibitor PP242. C×43 detected by western blot. (B) Primary neonatal mouse ventricular cardiomycoytes (NMVMs) incubated for 16 h with DMSO or PP242. C×43 detected by Western blot with quantitation of C-terminal fragment relative to full length (43kDa) in graph. (C) Fixed-cell immunofluorescence of cells from (B). Cell borders are identified with N-cadherin (red) for quantification of C×43 (green) gap junction density. Original magnification x 60. Scale bar: 25 μm. (D) Averaged fluorescence intensity profiles of C×43 expression at cell–cell borders. Data are presented as mean ±SEM. **P < 0.01, *P < 0.05.

