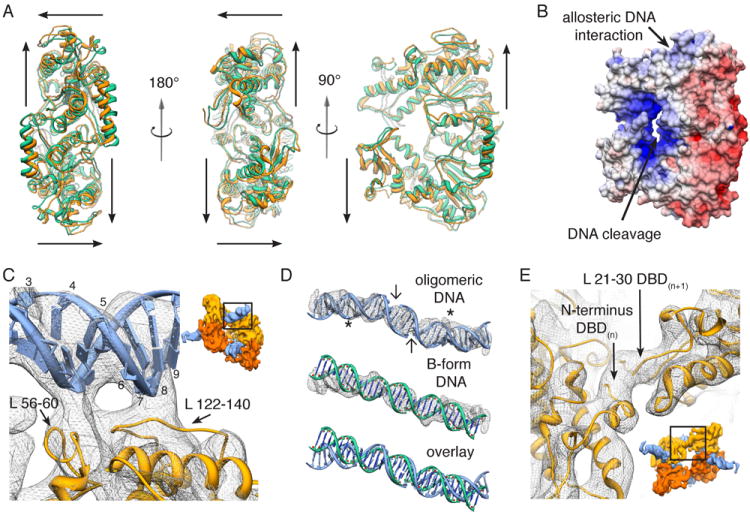
Figure 3. A conformational rearrangement establishes oligomer-specific interactions within activated SgrAI.

(A) Three different views of the crystal structure 3DVO(Dunten et al., 2008) (green) are shown overlaid on the flexibly fit coordinates of oligomeric SgrAI (orange). For each DBD, arrows diagram approximate movement from the starting to the ending structure (see also movie S2). (B) Surface electrostatic potential of a SgrAI DBD. (C) Close-up view of protein-DNA interactions within SgrAI’s allosteric DNA-binding site, as seen from the outside of the helix (inset). Protein loops 56-60 and 122-140, which are unique to SgrAI, are shown interacting in the vicinity of flanking bp 3-5 and 6-9, respectively, (numbered along one DNA strand) and along the minor groove of the DNA. (D) Comparison of the fit oligomeric PC-DNA with idealized B-form DNA. Oligomeric and B-form DNAs are overlaid on the EM density in mesh. Cleavage sites forming the two pre-cleaved DNAs are marked by arrows. Stars indicate the site of allosteric protein-DNA interaction. (E) Close-up view of SgrAI’s N-terminal interactions, as seen from the inside of the helix (inset). The N-terminus of DBD(n) makes apparent interactions with a portion of the N-terminal loop (aa 21-30) of DBD(n+1). See also Figure S4, Table S1 and Movie S2.
